The globalization of natural gas gains momentum
Geopolitical shifts and a tight LNG market heighten the need to manage price and supply risks
Updated March 2025

Trabue Bland
Senior Vice President Futures Exchanges, ICE
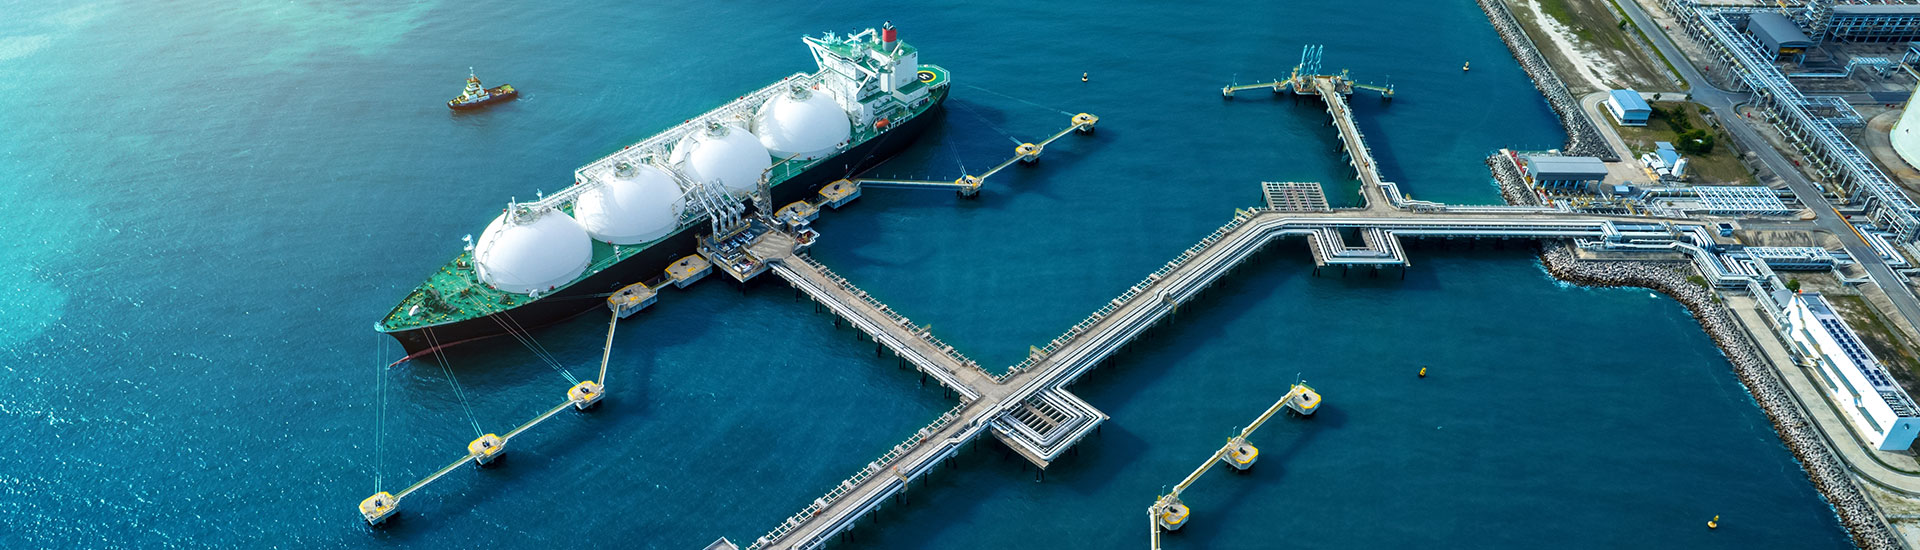
The formation of a global natural gas market is accelerating, driven by dynamics that have implications for trade, pricing, and the way market participants need to think about risk. It’s the continuation of a story which ICE has documented closely, supported by the rise of liquified natural gas (LNG) which liberated the fuel from landlocked infrastructure and created a virtual pipeline across oceans. Today, the shift from a procurement structure to one that is market-based continues, with the ongoing move toward real-time trading.
Geopolitical shifts have intensified market globalization and a need for risk management. The potential for a ceasefire deal between Ukraine and Russia has raised questions around how Europe will source its future energy: whether it reverts to buying Russian gas or continues to prioritize energy security from alternate sources. This decision will have wide-ranging price implications, after Russia’s invasion of Ukraine in 2022 forced a dramatic revision in how Europe sourced its gas – a dynamic that now sees the continent compete more intensely with Asia for U.S. LNG cargoes. European demand has also been driven by its lower gas reserves in early 2025, with price signals diverting relatively more U.S. LNG cargoes to the continent: at least seven U.S. cargoes were diverted from Asia to Europe in January 2025 alone, according to media reports.
Concerns about further European reserve depletion - coupled with the fact that global LNG production capacity is not expected to meaningfully increase until 2026 - mean tight market conditions will likely continue in 2025. As a result, competition for global LNG could intensify in coming months, with price volatility likely to remain above historic averages.
Other LNG demand drivers include the global transition to less carbon-intensive fuel sources. Natural gas emits about half as much carbon dioxide as coal to produce the same amount of energy, making it an important ‘partner fuel’ in the energy transition - particularly for developing economies which prioritize reliable, affordable fuel. In addition, the power demands of artificial intelligence are expected to require significant new generation capacity, boosting demand for natural gas. These dynamics have fed robust forecasts: as the world's largest LNG trader, Shell expects global LNG demand to rise over 50% by 2040, while Goldman Sachs forecasts global LNG export capacity to increase ~80% by 2030.
A more interconnected backdrop has seen the emergence of three key benchmarks for natural gas. In Europe, the Title Transfer Facility (TTF) is a central trading point for natural gas just as Brent Crude is the global barometer for oil pricing. In the Asia-Pacific, the Japan Korea Marker (JKM) reflects the spot market value of cargoes delivered into a region that represents a key demand center. In North America, Henry Hub is a complement to regional basis markets across the country, and one of the most traded natural gas contracts. In Canada, the AB-NIT (“AECO”) hub could become more significant as the country enters export markets with a key advantage: its Asia-bound LNG cargoes have a far shorter trip than those from the U.S. At ICE, we are the only platform that offers liquid markets in Henry Hub, TTF and JKM - the broadest range of natural gas benchmarks with trading hubs across the U.S., Canada, Europe, and Asia.
How a European benchmark became king
Prior to Russia’s invasion of Ukraine, Europe had enviable flexibility in its gas supply. Its access to pipeline gas and LNG from Norway, the Netherlands, Russia, and the UK, alongside its coal-to-gas switching and regasification capacity made it the global ‘balancing market’ for natural gas. This meant it could easily absorb excess supply or provide more gas for export. This deep liquidity saw TTF become the European hub with greatest number of market participants, trading the largest volumes and widest range of products over the curve.
The withdrawal of Russian pipe gas from Europe was a seismic shock for the region’s energy security. As Europe moved to secure its energy supply from new sources - namely the U.S. and Norway - TTF asserted its position as a global benchmark by providing daily price signals throughout the upheaval. Europe adjusted from sourcing ~40% of its gas from Russia to a negligible amount today, with TTF derivatives sending critical price signals that helped balance supply and demand, while identifying and clearing infrastructure bottlenecks.
Today, TTF is the dominant index for EU spot contracts1 and increasingly used for long-term term hedging needs (traders can hedge out to calendar year 2033). TTF also serves as a pricing indicator to determine the destination of a given cargo and to hedge its price risk, while contract tenders around the world are priced relative to the benchmark. Importantly, TTF’s rise has been facilitated by broader participation from financial market players - hedgers, arbitragers, and speculators. This is a positive reflection of the evolution of the TTF secondary market, and a development which brings greater liquidity, helping to reduce bid offer spreads and trading costs for all market participants.
Europe’s heightened demand for natural gas has seen it become the main buyer for U.S. LNG since 2022: in 2024, it accounted for 55% of total U.S. LNG exports. Infrastructure developments across Europe mean the continent’s LNG import capacity continues to grow, alongside its dependence on it. This will make TTF prices more subject to changes in global dynamics - for example, a June 2024 outage at an Australian LNG project caused an immediate reaction in TTF prices. Against this backdrop, the need for TTF derivatives is clear. Open Interest in ICE’s TTF complex is up 34% for the year to January 2025, while average daily volumes are 32% higher. In this way, TTF is becoming embedded across financial markets, cementing its status as a global benchmark.
Energy markets and supply chains grow in complexity
The transition to a global gas market is marked by complexities that require savvy risk management. For example, growing recognition of the distinct roles of oil and gas - where oil is primarily a transport fuel and gas is used for power, heating and some shipping - has seen the growth of gas-on-gas pricing. Yet Brent indexed agreements still represent a substantial portion of global LNG supply contracts. This means many traders must manage potential moves in both Brent vs gas prices and gas-on-gas contracts. Here, ICE’s Brent complex includes a vast range of hedging instruments, with additional margin offsets against non-oil contracts.
The growth of spot pricing also underscores the need for risk management. Greater flexibility in gas supply - in terms of volume, destination, and pricing - has supported the development of a spot market, where prices can either be fixed or tied to oil or gas. The variability of these dynamics has seen traders, producers and suppliers turn to a range of derivative contracts to manage their price and supply risks.
Regulatory change around the energy transition also presents uncertainty. Since the start of 2024, shipping within the European Union has fallen under the EU-ETS carbon scheme - requiring vessels to buy EUA carbon certificates. This raises variable shipping costs and could increase the relative price of shipping LNG to Europe vs other regions. It highlights the need for risk management when shipping gas around the world - a fuel that remains more difficult to move than energy sources like oil.
Against a fragile backdrop for LNG, the ability to quickly enter and exit a position is highly valued by market participants. While ICE has a large range of contracts which offer precision at various price points for specific locations, we see a clear preference by traders for liquidity over access to price differentials. Here, TTF - with its deep liquidity and status as the “Brent” of natural gas markets - is typically favored as a more reliable way to hedge international price risk.

The U.S. emerges as a top exporter
Each day, the U.S. exports ~12.5 billion cubic feet of LNG to help fuel economies across Europe and Asia. It’s a dynamic underpinned by the fracking boom, which saw the U.S. become the world’s top LNG exporter for the first time in 2023 as it overtook Australia and Qatar. Most U.S. LNG export facilities are located on the Gulf Coast, within relative proximity to Henry Hub - a natural gas pipeline in Louisiana, and the official delivery point for futures contracts. The proximity of Henry Hub to the Gulf of Mexico makes Henry Hub an excellent proxy for U.S. LNG contracts.
Europe and Asia will continue to compete for U.S. LNG through the prices they are willing to pay: more U.S. LNG has made its way to Europe than Asia in recent years, as the continent recalibrates its energy supply sources. While Europe’s LNG demand is expected to moderate as it develops renewable energy, this process will be gradual. Meanwhile across Asia, fast-growing economies and an increasing focus on environmental concerns mean the region will continue to be a key LNG demand center. Collectively, this means overall global demand should remain steady - even amid demand swings between individual countries due to factors like weather, storage, and pricing. For this reason, it’s the interaction between Europe’s TTF and Asia’s JKM that will determine global gas pricing as both continents compete for U.S. cargoes. Equally, while North America’s status as a key exporter will feed demand for a market-based pricing mechanism, Henry Hub remains predominantly a U.S. benchmark, with less correlation between U.S. natural gas prices and those in Europe or Asia.
Many market participants seeking to manage exposure to U.S. natural gas price dynamics gravitate toward ICE’s Henry Hub contracts for the unique liquidity they offer in longer-dated tenors. Alongside this, ICE offers hundreds of physically delivered and cash settled contracts across North America, so customers can manage the difference in price of natural gas delivered at each hub. ICE’s U.S. financial gas markets cover 70 hubs across North America, allowing customers to manage regional supply and demand dynamics so they can hedge the cost of gas at a specific area. These hubs are priced at a differential to Henry Hub to reflect regional market conditions, transport costs, and transmission capacity between locations.
Asia: balancing energy demand with carbon reduction
Across the Asia-Pacific, surging economic growth means the region is asserting its position as a key demand center for LNG. While coal still accounts for nearly half the region’s energy supply, ICE’s Japan/Korea Marker or JKM, has seen market participation grow double digits on average over the past five years. Other factors supporting regional LNG demand include the lifting of destination restrictions on natural gas contracts, shorter term trading, and a need to manage the input cost of gas given deregulation in importing markets. While Asia’s LNG demand is expected to grow near-term, the outlook after 2030 is uncertain -- estimates range between demand growth of 15% to 100% depending on the transition to lower carbon energy sources.
JKM is the price benchmark for Asian natural gas, providing transparency to the value of LNG arriving in Japan, South Korea, China and Taiwan. ICE launched the JKM (Platts) Future in 2012, a cash-settled futures contract based on the index. The futures contract allows traders to offset price risk while transporting LNG cargoes, protects producers against downside risks, and allows gas consumers to hedge their exposure to price volatility. The ICE JKM (Platts) Future settles against the Platts JKM spot price, providing strong correlation between the financial and physical markets.
In recent years, ICE’s JKM volumes have shifted from being ~50% composed of the JKM-TTF spread to two-thirds, reflecting the extent to which the interplay of TTF and JKM determines pricing in global gas markets. In early 2025, higher European demand for U.S. LNG has seen TTF trade at a premium to JKM, reflecting Europe’s lower gas reserves and a reliance on less carbon-intensive fuels. This upends a traditional paradigm which saw JKM trade at a premium to TTF - a shift which underscores an opportunity for financial players to take a view on price. In a market with increasingly fluid supply-demand dynamics, many commercial participants have also recalibrated their view on the outlook, turning to liquid markets to hedge their portfolios. This demand was reflected in ICE’s record Asian gas volumes in January 2025, with average daily volumes up 40% for the year, while OI was up 52%.
JKM’s reputation has been further bolstered as its participant pool broadens and more data inputs go into its determination. A growing number of contract tenders cite the marker as a reference price - for example, term contracts of one to three years duration for northeast Asia are largely linked to the JKM benchmark, while regulators in Thailand and Indonesia are said to use JKM as the primary price reference when approving spot trading and term contracts.
Canada: a new exporter emerges
Canada’s LNG sector is poised to become more integrated with global dynamics due to new infrastructure which will allow the country to take advantage of prices paid on international markets. The emergence of Canada as an LNG exporter could see it compete with the U.S. to fulfil global gas demand, shifting a dynamic which currently sees the country export 45% of its gas to the U.S. with the remainder used domestically.
Canada’s seven LNG export facilities and one infrastructure project – all located in British Columbia - represent potential LNG production capacity of 50.3 million tonnes per annum, with most of these projects targeting between 2027-2030 to begin operations. The first project from LNG Canada, is expected to begin commercial operations in 2025 and is designed to have the lowest carbon intensity of any large-scale LNG export facility today, with emissions 60% lower than the global weighted average.
For Asian-based buyers, Canadian LNG has other crucial advantages. Shipping routes mean its LNG vessels can reach northeast Asia ~15 days faster than those from the U.S. Gulf Coast, potentially cutting shipping costs, tolls, and the risk of congestion faced on U.S. routes via the Panama Canal.
The emergence of Canada as an LNG exporter comes at an opportune time: many countries are seeking to diversify their gas sources as Russia’s war on Ukraine underscores the importance of stable trading partners. In the medium term, Canada could export ~5 to 6 billion cubic feet of LNG a day and become a more meaningful player on the global stage. Longer term, a broader question may be the impact of LNG exports on Canada-U.S. market pricing, where the U.S. could be forced to compete on global markets with Asia for Canadian gas.
Since early 2025, a new factor has entered the international gas markets in the form of U.S. tariffs and the reciprocal actions taken by impacted trade partners. This development has raised market uncertainty, demonstrating the value of ICE’s comprehensive energy contract complex in assisting customers to manage risk. ICE allows market participants to take a position or hedge their risk either physically through the Calgary-based ICE Natural Gas Exchange (ICE NGX) or financially through ICE Futures U.S. natural gas products. ICE NGX has operated in the Alberta natural gas and electricity futures markets for 30 years, developing the AB-NIT ("AECO") hub into one of North America’s most liquid spot and forward energy markets.
Conclusion
Today, gas market participants operate in a world of heightened risk and uncertainty: in supply, geopolitics, trade and tariff discussions, and market tightness. As gas markets become more globalized, we see growing evidence that participants want to understand a broad range of inputs around pricing: European counterparties are asking about North American gas markets, while U.S.-based traders are inquiring about the price of TTF, ICE’s basis markets, and our Henry Hub contract.
This reflects a market that is increasingly interconnected, where any shocks could have a knock-on effect for global prices. Similarly, a cold winter in Asia can boost LNG prices for European clients forced to compete for U.S. cargoes, while a hot summer in North America can make it harder to produce LNG. It’s a dynamic that demands flexibility from market participants - and an increasingly global perspective - as they seek to manage risk, hedge pricing, and identify opportunity.
1. Link
This publication contains information that is confidential and proprietary property and/or trade secret of Intercontinental Exchange, Inc. and/or its affiliates, is not to be published, reproduced, copied, disclosed or used without the express written consent of Intercontinental Exchange, Inc. and/or its affiliates.
This publication is provided for informational purposes only. The information contained herein is subject to change and does not constitute any form of warranty, representation, or undertaking. Nothing herein should in any way be deemed to alter the legal rights and obligations contained in agreements between Intercontinental Exchange, Inc. and/or any of its affiliates and their respective clients relating to any of the products or services described herein. Nothing herein is intended to constitute legal, tax, accounting, investment or other professional advice. The information found herein is neither an offer to sell nor a solicitation of an offer to buy any financial product(s). Those considering buying or selling any financial product(s) should independently consider the risk in doing so, and also any legal and regulatory requirements applicable to them in the relevant jurisdiction.
Intercontinental Exchange, Inc. and its affiliates, makes no representations or warranties whatsoever, either express or implied, as to merchantability, fitness for a particular purpose, or of title, non-infringement, quality or any other matter. Without limiting the foregoing, Intercontinental Exchange, Inc. and its affiliates makes no representation or warranty that any data or information (including but not limited to evaluations and calculations) supplied to or by it are complete or free from errors, omissions, or defects nor does it guarantee the timeliness, accuracy or completeness of any of its data or the accuracy or completeness of the IFEU Intellectual Property. No oral or written information or advice given by IFEU shall create a warranty and the information or advice may not be relied upon.
Trademarks of Intercontinental Exchange, Inc. and/or its affiliates include Intercontinental Exchange, ICE, ICE block design, NYSE, ICE Data Services, ICE Data and New York Stock Exchange. Information regarding additional trademarks and intellectual property rights of Intercontinental Exchange, Inc. and/or its affiliates is located at www.intercontinentalexchange.com/terms-of-use. Other products, services, or company names mentioned herein are the property of, and may be the service mark or trademark of, their respective owners.
© 2025 Intercontinental Exchange, Inc.
Trade the global gas market
Resources
Key takeaways
- A more interconnected global gas market underscores the importance of understanding a range of inputs around risk and pricing.
- The potential for a ceasefire between Ukraine and Russia has raised questions around how Europe will meet its future energy needs – a decision with wide-ranging price implications. The removal of Russia as a key gas supplier to Europe since 2022 and lower reserves across the continent have seen it compete more intensely with Asia for U.S. LNG cargoes.
- Global LNG production capacity is not expected to meaningfully increase until 2026, setting the stage for tight market conditions in 2025, with price volatility likely to remain above historic averages.
- A market with increasingly fluid supply-demand dynamics offers an opportunity for financial players to take a view on price. Many commercial participants are also recalibrating their view on the outlook, turning to liquid markets to hedge their portfolios.
- ICE offers the broadest range of natural gas benchmarks with trading hubs across the U.S., Canada, Europe, and Asia via liquid markets in Henry Hub, TTF and JKM.