
Climate risk and socioeconomic vulnerability: a global pattern
Published
February 2024
Representatives of developing countries and small island developing states have repeatedly pointed out that their countries tend to have higher physical climate risk than developed countries. Many have also pointed to what they see as a fundamental unfairness— socioeconomically vulnerable countries as a group have historically contributed less to global greenhouse gas emissions than industrialized nations, yet they now bear a disproportionate share of the consequences in terms of physical risk. The Prime Minister of Barbados, Mia Mottley, summarized this perspective in 2022, during her speech at the COP27 summit: “We were the ones whose blood, sweat and tears financed the industrial revolution. Are we now to face double jeopardy by having to pay the cost as a result of those greenhouse gases from the industrial revolution? That is fundamentally unfair.”
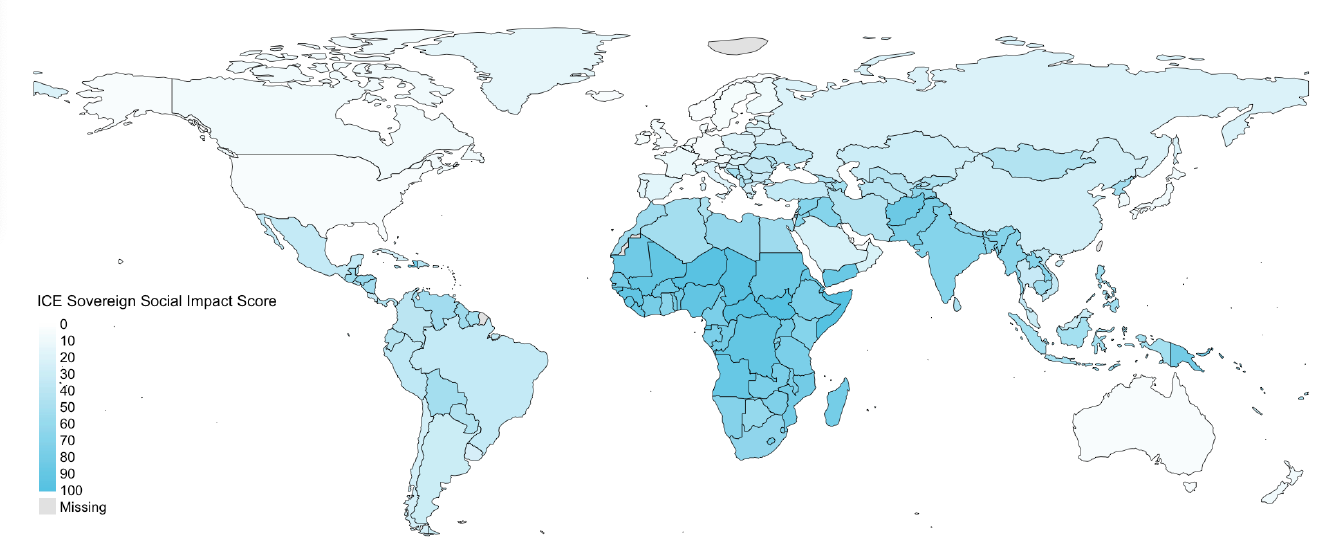
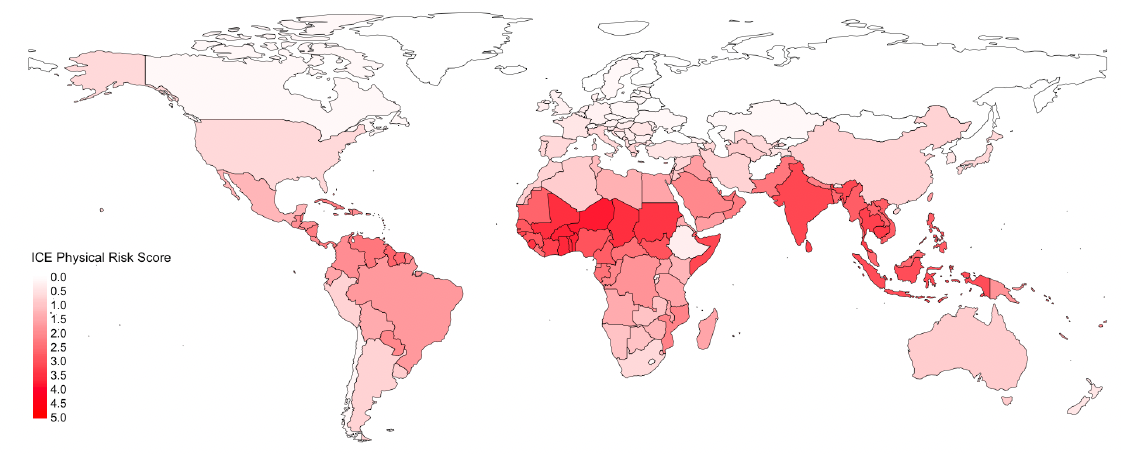
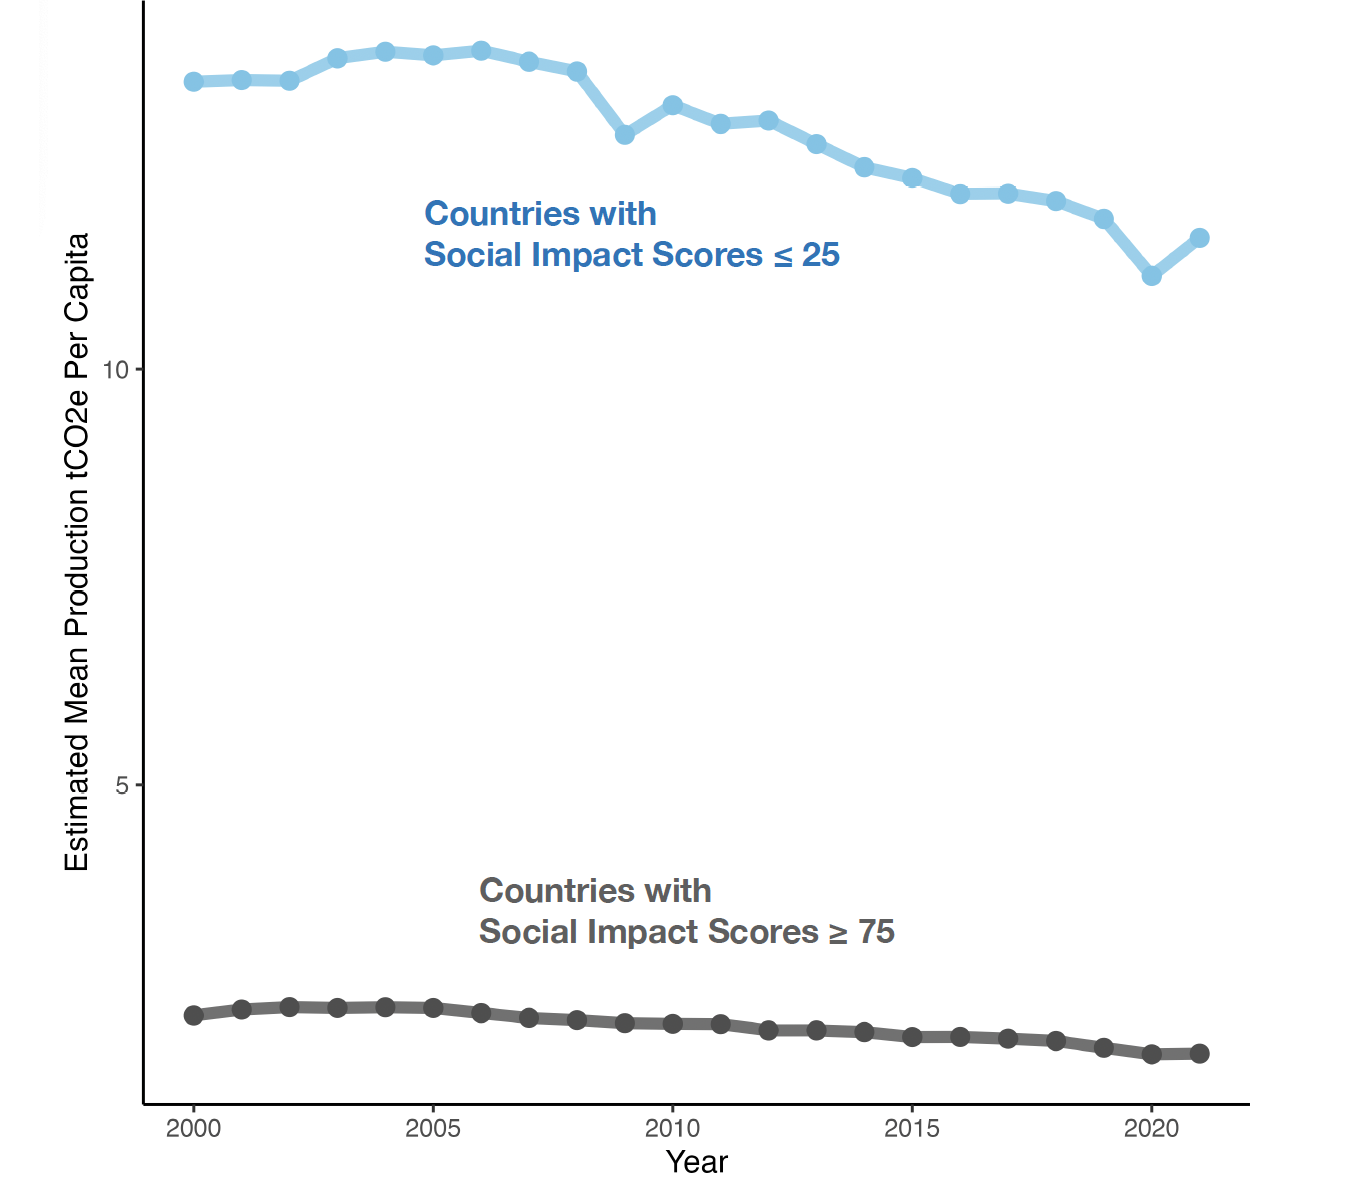
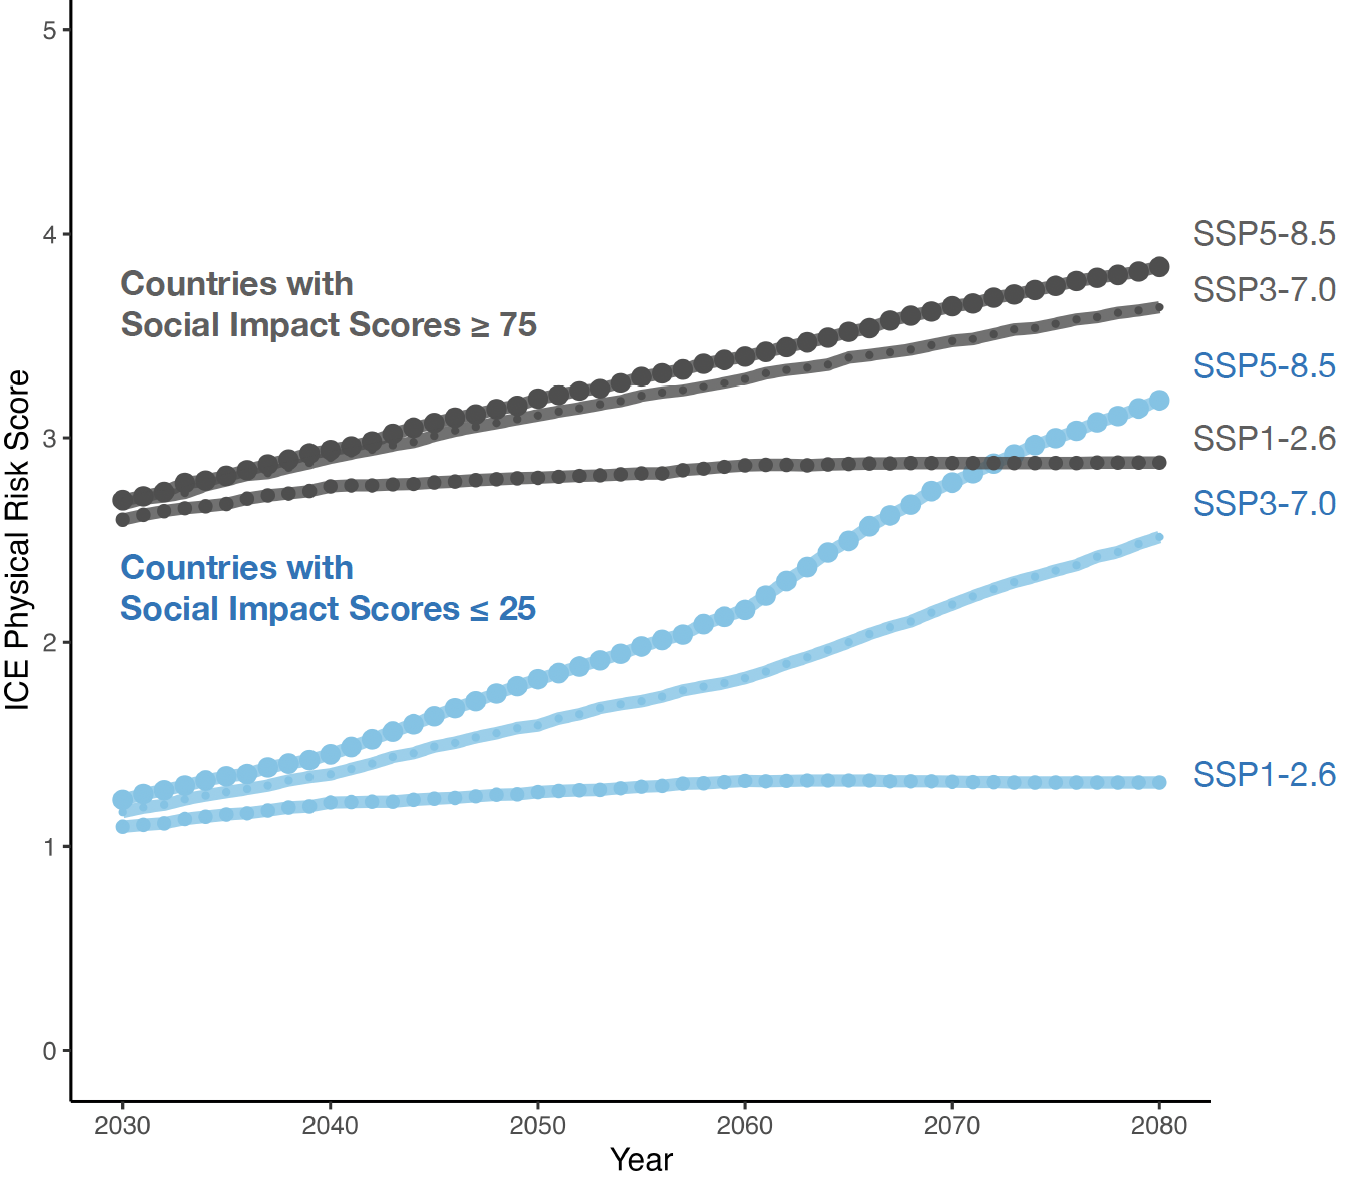
These patterns can be seen through the lens of ICE Sustainable Finance’s Physical Risk and Social Impact Scores (Figures 1 and 2). The ICE Sovereign Social Impact Score quantifies the socioeconomic vulnerability of countries around the world, synthesizing a wealth of information about health, poverty, housing costs, and employment. The ICE Physical Risk Score measures the physical climate risk associated with chronic perils including heat, drought, and water stress for countries around the world, incorporating state-of-the-art global climate models to project risk into the future from 2030-2080 under three different emissions scenarios. Historical ICE Physical Risk Scores are also constructed from estimates of economic and human losses based on historical observations from 1980-2018.
These scores are designed to be easy to interpret. ICE Social Impact Scores range from 0-100, where values of 100 are assigned to the most socioeconomically vulnerable countries, and ICE Physical Risk Scores range from 0 to 5, where 5 corresponds to countries with the highest risk.
ICE Sovereign Social Impact Score (2020)
ICE Physical Risk Score (Historical)
ICE Sovereign Social Impact Scores &
Physical Risk Scores
(Emissions)
Physical Risk Scores
(Debt Distress)
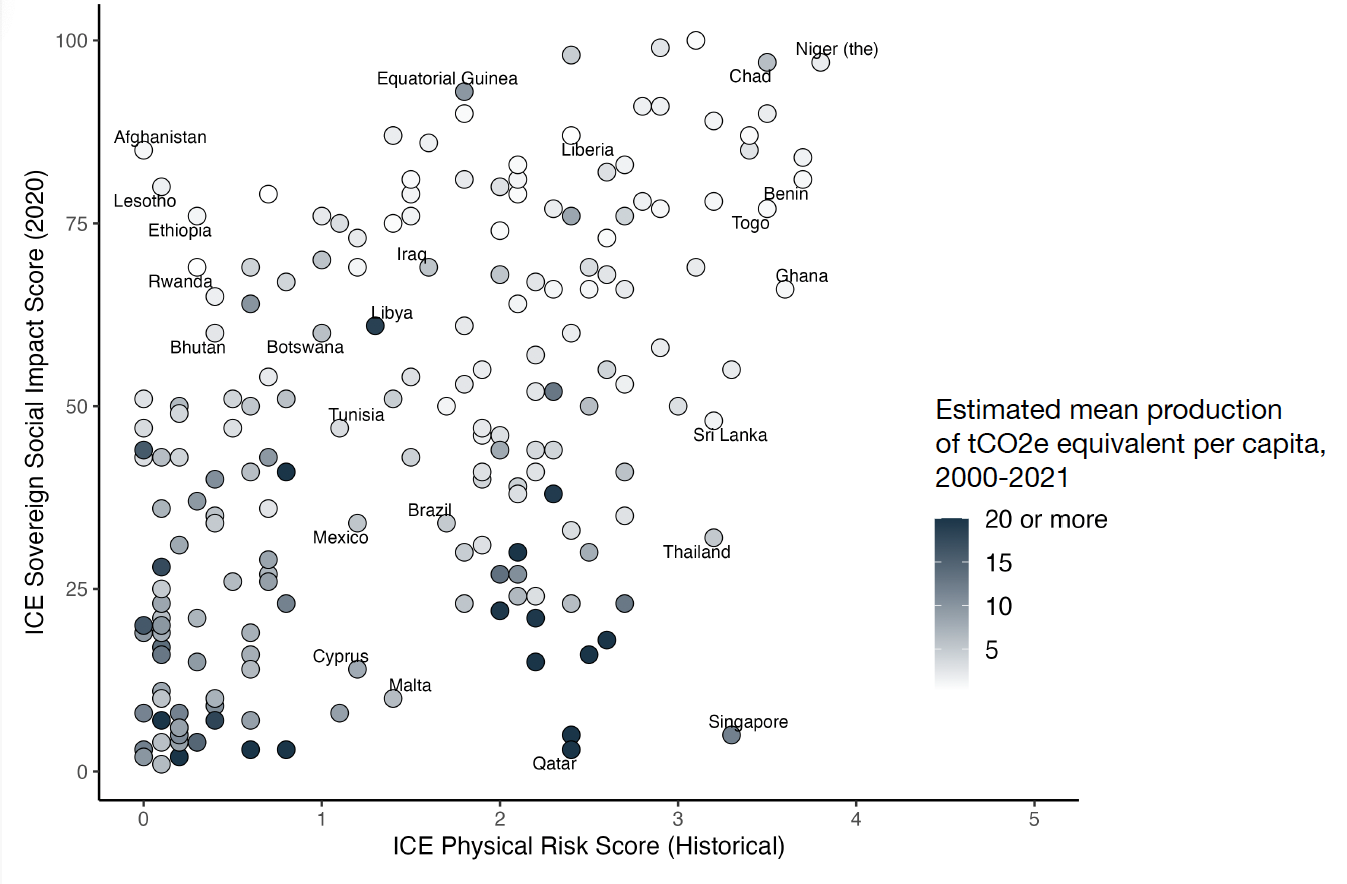
Across 191 countries, the correlation coefficient between ICE Sovereign Social Impact Scores and historical ICE Physical Risk Scores is 0.5, suggesting that the scores do have a weakly linear relationship (Figure 2). The association is perhaps clearest at the extremes: of all countries with high (>3.5) Historical ICE Physical Risk Scores, for example, all of them have Sovereign Social Impact Scores greater than 50.
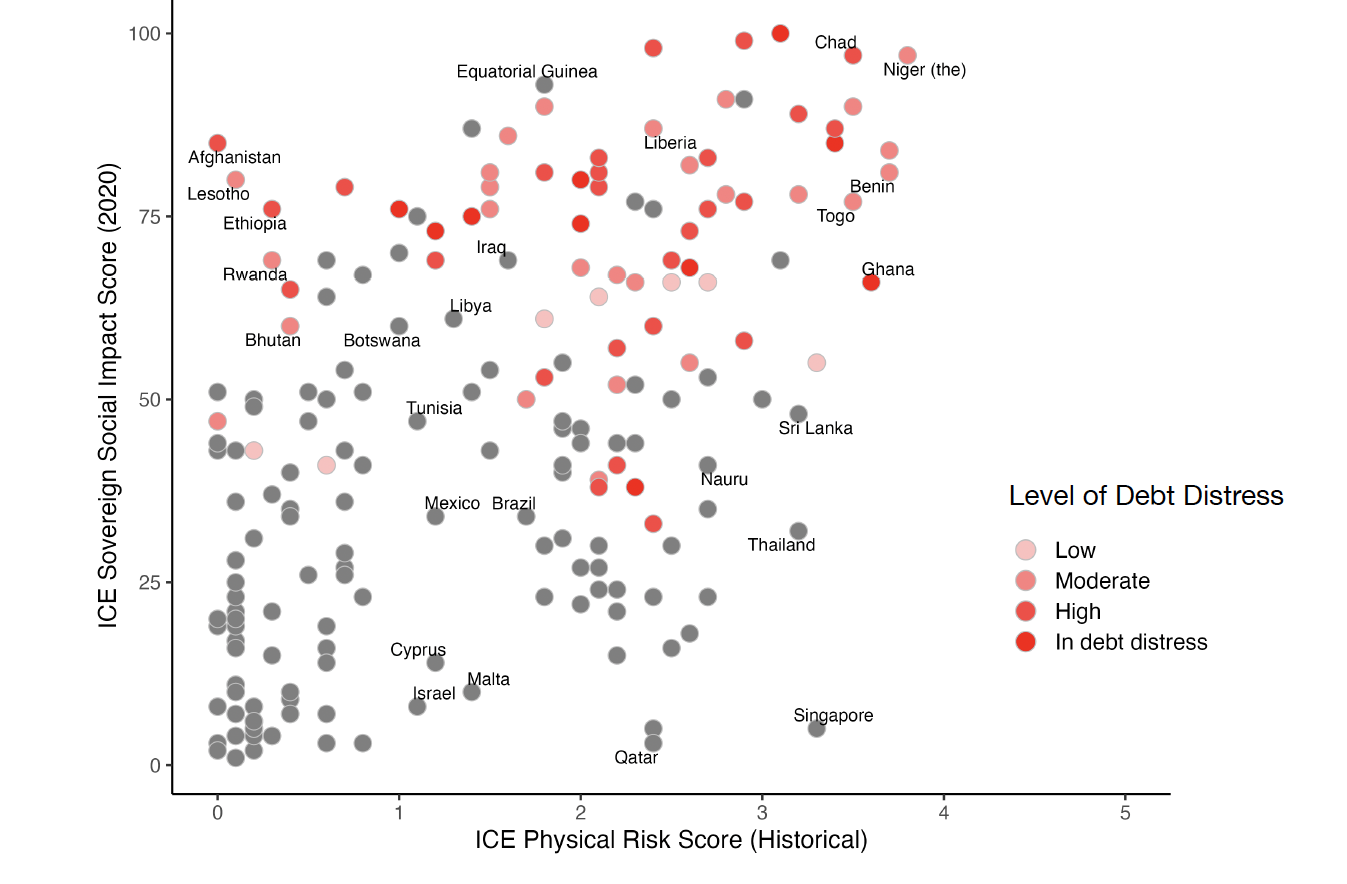
These patterns have significant implications for sovereign debt markets and sovereign debt sustainability across the world. Many high-risk countries are already struggling under large debt burdens; two-thirds (12 of 18) of countries at high physical risk (Historic ICE Physical Risk Score ≥ 3) are currently listed in the International Monetary Fund’s (IMF) Debt Sustainability Analyses for Poverty Reduction and Growth Trust Eligible Countries as being in debt distress or having moderate or high risk of debt distress (Figure 2). Given their existing debt burdens, these at-risk countries would likely face high borrowing costs if they wished to fund large-scale climate mitigation and adaptation projects that might help protect their people and economies.
Estimated Production tCO2e Per Capita
2000-2021
ICE Physical Risk Scores
2030 - 2080
In the context of international fixed income markets, there is evidence that climate vulnerability is already priced into sovereign bonds to some degree, but the relative impacts of socioeconomic factors and climate risks are difficult to untangle. If climate risks become more integrated into bond pricing suddenly, in the wake of a series of extreme weather events or climate-related natural disasters, it could have a destabilizing effect. On top of this, pricing in climate risks may well put further financial strain on the countries already bearing the brunt of the physical risks. For all these reasons, sustained commitment from well-resourced countries and investors to fund climate adaptation projects in developing countries could not only protect millions of lives—it could also promote geopolitical and macroeconomic stability and make global supply chains more resilient in the face of extreme weather events.
1. On the Frontline of the Climate Crisis, World’s Most Vulnerable Nations Suffer Disproportionately. (Accessed 4 Jan 2020.) United Nations, Office of the High Representative for the Least Developed Countries, Landlocked Developing Countries, and Small Island Developing States. Link
2. Psaledakis, D & M Nichols (24 Sep 2021). ‘Death Sentence’: low-lying nations implore faster action on climate at UN. Link
3. On the Frontline of the Climate Crisis, World’s Most Vulnerable Nations Suffer Disproportionately. (Accessed 4 Jan 2020.) United Nations, Office of the High Representative for the Least Developed Countries, Landlocked Developing Countries, and Small Island Developing States. Link
4. Greenfield, P, Harvey, F, Lakhani, N, & Carrington, D (7 Nov 2022). Barbados PM launches blistering attack on rich nations at COP27 climate talks. Link
5. The International Monetary Fund’s List of Low Income Country Debt Sustainability Analyses for Poverty Reduction and Growth Trust Eligible Countries (LIC DSAs for PRGT-Eligible Countries as of August 31, 2023). Accessed Nov 17, 2023. Link
6. IMF List of LIC DSAs for PRGT-Eligible Countries as of August 31, 2023
7. IMF List of LIC DSAs for PRGT-Eligible Countries as of August 31, 2023
8. Beirne J, Renzhi N, Volz U (2021). Feeling the Heat: Climate risks and the cost of sovereign borrowing. International Review of Economics and Finance, 76, 920-636.