
Insurance affordability: a growing risk to home prices and mortgage-backed securities
Published
May 2024

Director, Business Development
Around 10M U.S. homes could face material price declines under ICE DeltaTerra base modelling scenario.
Climate risks pose an unprecedented challenge to real estate across many areas of the United States as property insurance markets undergo a volatile and seismic shift. Our research into market impacts reveals material considerations for homeowners as well as buyers of credit-sensitive mortgage securities like CRT, CMBS, and Non-Agency RMBS.
The deteriorating affordability of insurance to protect against hazards such as flood and wildfire is at the center of all these challenges. This is largely being driven by sharp increases in policy premiums, as providers try to calibrate their pricing relative to the true risk posed or cease new business operations in certain geographic areas altogether. We call this the rationalization of insurance.
In testimony to Congress recently, Fed Chair Powell noted that climate change posed a long-term risk. A recent article suggests a more near-term impact could warrant closer consideration by the central bank given implications for home ownership.
Based on data from the Federal Emergency Management Agency (FEMA), the average cost of flood insurance coverage has trended upward for at least the last decade. However, in just the last few years, a divergence formed between the trajectory of insurance pricing for new policies compared with existing policies that are being renewed. This is tied to FEMA guidelines that limit annual policy premium increases to 15%, whereas new policies are quoted at a fully rationalized price through FEMA’s new Risk Rating 2.0 methodology.
Average cost per dollar of flood insurance coverage
Source: DeltaTerra Capital, ICE, OpenFEMA
Data as of 3/28/2024
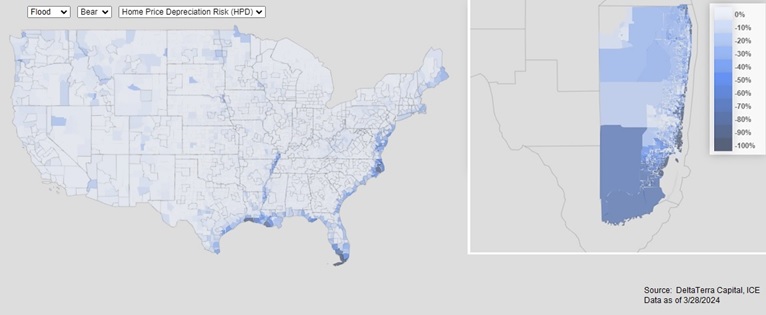
U.S. Homes facing material flood insurance-driven home price depreciation
Source: DeltaTerra Capital, ICE
Data as of 3/28/2024
Utilizing our visualization tools, we can also see where this risk is concentrated across the country. For flood hazards, both inland and coastal sensitivity is evident. ICE climate data captures FEMA-mapped flood risk as well as unmapped inland and unmapped coastal flood risk. For illustrative purposes, we’ll drill into the state of Florida and examine HPD projections in the Miami metro area. In a bear scenario, the model output is quite dire with price declines of more than -50% projected for approximately 355,000 Miami single-family residences, or roughly 28% of total stock of homes located in the metro area.
For certain real estate market participants, this granularity may be adequate. However, securitized investors typically require security specific data to help inform prudent decision making. The ICE DeltaTerra Climate Credit Analytics solution is built to provide metrics at the deal and CUSIP levels. To demonstrate the power of this capability, we can analyze all outstanding Credit Risk Transfer (CRT) securities that have been issued by Fannie Mae and Freddie Mac via their CAS and STACR shelves, respectively. Building on the projections for potentially steep HPD projections in Miami, we can estimate the negative effects that may have on bond prices should it come to fruition. Interestingly, while only 2% of outstanding CRT balance is exposed to Miami, the estimated contribution of Miami loans to total CRT projected bond losses from climate-driven insurance repricing is much larger at 12%.
GSE CRT total outstanding balance
GSE CRT total project loss from climate-driven insurance repricing
GSE CRT total outstanding balance
GSE CRT total project loss from climate-driven insurance repricing
Source: DeltaTerra Capital, ICE
Data as of 5/14/2024
This industry-wide information is useful to quantify the scope and scale of certain risks facing securitized investors, but aggregations can sometimes mask nuances that exist below the surface. CRT deals tend to be well diversified, typically referencing more than 50 thousand loans from a quarter or more of agency origination across the entire country. While this leads to similar geographic footprints from one deal to the next, the interaction of this exposure with other collateral and structural features can lead to very different implications for any specific CRT security. Illuminating these requires analysis that accounts for structural elements, collateral aging, and geospatially precise climate risk modeling. For example, if we rank CRT bonds by exposure to Miami collateral, it is not clear that simply steering clear of those with relatively high Miami concentration would be an effective investment strategy. To demonstrate, we have compared two CRT bonds. CRT “Bond A” has 4.6% of its loan collateral located in Miami and a projected bond loss due to climate-driven insurance repricing of -6.3%. Compare that to CRT “Bond B”, which only has 1.3% Miami exposure but a projected bond loss of -31.1%.
Agency CRT bond loss versus collateral exposure
Source: DeltaTerra Capital, ICE
Data as of 5/14/2024
As climate change risk becomes more evident and property insurance markets undergo this period of disruptive change, tools that help securitized investors quantify and manage climate-driven value correction risk are essential.
Learn more about ICE DeltaTerra Climate Credit Analytics.
1. DeltaTerra studies the difference between property owners’ current insurance costs and scientifically derived physical damage expectations for each major hazard type (wind, fire, and four types of flood risk) in each census tract. In the Base case, future damage expectations are calibrated to a middle-of-the-road IPCC scenario, Representative Concentration Pathway (RCP) 4.5. The Bear scenario would be one in which property investors make additional allowances for future uncertainty and begin to embrace expectations resembling the IPCC’s RCP 8.5 climate scenario, which scientists expect to come about if greenhouse gas mitigation efforts fail to advance beyond those in place today.