
- Environmental hazards like air pollution and chemical contamination have negative health impacts for many communities across the U.S.
- For local governments, contaminated areas can also affect property values, shrinking the local tax base
- The ICE Environmental Hazard Score is an assessment of an area’s exposure to a range of environmental hazards. For municipal bond market participants, this metric may be useful in assessing risks and potential future costs — and identifying communities that could benefit from investments in clean-up and mitigation
Many communities across the United States are exposed to environmental hazards like air pollution and chemical contamination. The implications for the physical health and well-being of residents can often be significant. High concentrations of airborne particulate matter are linked to elevated asthma rates, cardiovascular disease, lung cancer and death.1 Land pollution from mines, industrial waste sites and chemical spills can make drinking water unsafe; exposure to industrial toxins has been linked to elevated cancer rates in nearby communities.2 Noise pollution from traffic has also been associated with negative effects on children’s cognition and achievement levels in school.3
These hazards also affect local governments in multiple ways. Contaminated areas can have a negative impact on property values, shrinking the local tax base and in some cases causing residents to move away, as was the case with the East Palestine, Ohio train derailment.4
Indirect additional costs — city worker overtime, local remediation efforts, water testing — increase the financial burden on these governments still further. To assess the overall exposure of communities across the United States to environmental hazards, ICE Climate has developed the ICE Environmental Hazard Score.
The ICE Environmental Hazard Score is constructed using data from the U.S. Environmental Protection Agency (EPA), the U.S. Census Bureau, and the U.S. Bureau of Mines. The following hazards are incorporated into the score:
| Environmental Hazard | Definition |
|---|---|
| Particulate Matter Concentrations in Ambient Air (2.5) | The weighted annual mean of ambient PM2.5 concentration (µg/m^3). (Source: ICE Climate and the EPA) |
| Surface Ozone Concentration | The fourth-highest daily maximum eight-hour average ozone level through the year (ppm) (Source: ICE Climate and the EPA) |
| Air Toxin Cancer Risk | A lifetime cancer risk of "N"-in-1 million ("N" is a number). This means that for every one million people who are exposed to a specific level of pollutant over 70 years, one person may get cancer. (Source: ICE Climate and the EPA) |
| Toxic Releases (Air) | The annual toxic chemicals released (including spilling, emptying, leaching and disposing) into air from production-related waste in thousands of pounds per square mile. (Source: ICE Climate and the EPA) |
| Toxic Releases (Land) | The annual toxic chemicals released into land from production-related waste in thousands of pounds per square mile. (Source: ICE Climate and the EPA) |
| Toxic Releases (Water) | The annual toxic chemicals released into water from production-related waste in thousands of pounds per square mile. (Source: ICE Climate and the EPA) |
| Diesel Particulate Matter Concentrations | Estimated ambient diesel exhaust particulate matter concentrations in micrograms per cubic meter (µg/m^3). (Source: ICE Climate and the EPA) |
| Percentage of Pre-1980 Housing | The percentage of housing that was built pre-1980, indicating that a house may contain lead-based paint. (Source: ICE Climate and U.S. Census) |
| Superfund Sites | The percentage of the population estimated to live within 1600 meters (1 mile) of a superfund site. (Source: ICE Climate and the EPA) |
| Coal Mines | The percentage of the population estimated to live within 1600 meters (1 mile) of a coal mine. (Source: ICE Climate and U.S. Bureau of Mines) |
| Lead Mines | The percentage of the population estimated to live within 1600 meters (1 mile) of a lead mine. (Source: ICE Climate and the EPA) |
| Treatment, Storage, and Disposal Clean-up Sites | The percentage of the population estimated to live within 1600 meters (1 mile) of TSD sites. (Source: ICE Climate and the EPA) |
| Risk Management Program Sites | The percentage of the population estimated to live within 1600 meters (1 mile) of RMP site. (Source: ICE Climate and the EPA) |
| Airports | The percentage of the population that lives within 1600 meters (1 mile) of an airport. (Source: ICE Climate) |
| Highways | The percentage of the population that lives within 1600 meters (1 mile) of a highway. (Source: ICE Climate and U.S. Census) |
| Railroads | The percentage of the population that lives within 1600 meters (1 mile) of a railroad. (Source: ICE Climate and U.S. Census) |
| Impaired Water | The percentage of water that is impaired/polluted. Impaired waters are defined by section 303d of the U.S. Clean Water Act. A total maximum daily load for a list of pollutants in the water is monitored. (Source: ICE Climate and the EPA) |
The score is constructed by normalizing each hazard, summing across the hazards to obtain a composite metric and then scaling the resulting values into a score between zero and five. A higher ICE Environmental Hazard Score indicates more exposure to the suite of environmental hazards. Accompanying the score are two additional metrics that incorporate information about relative exposure — the percent of the population within a given area that live in communities in the top 25th and bottom 25th percentile of the score’s national distribution. ICE Climate builds the scores based on data about these hazards at the census tract level. Using our spatial downscaling and re-aggregation techniques, these scores can then be estimated for all municipalities and areas of interest across the country.
What can the Environmental Hazard Score tell us?
Areas with high Environmental Hazard Scores can be found throughout the country, with some of the highest scores in large cities such as Chicago, New York, and Philadelphia (Figure 1).
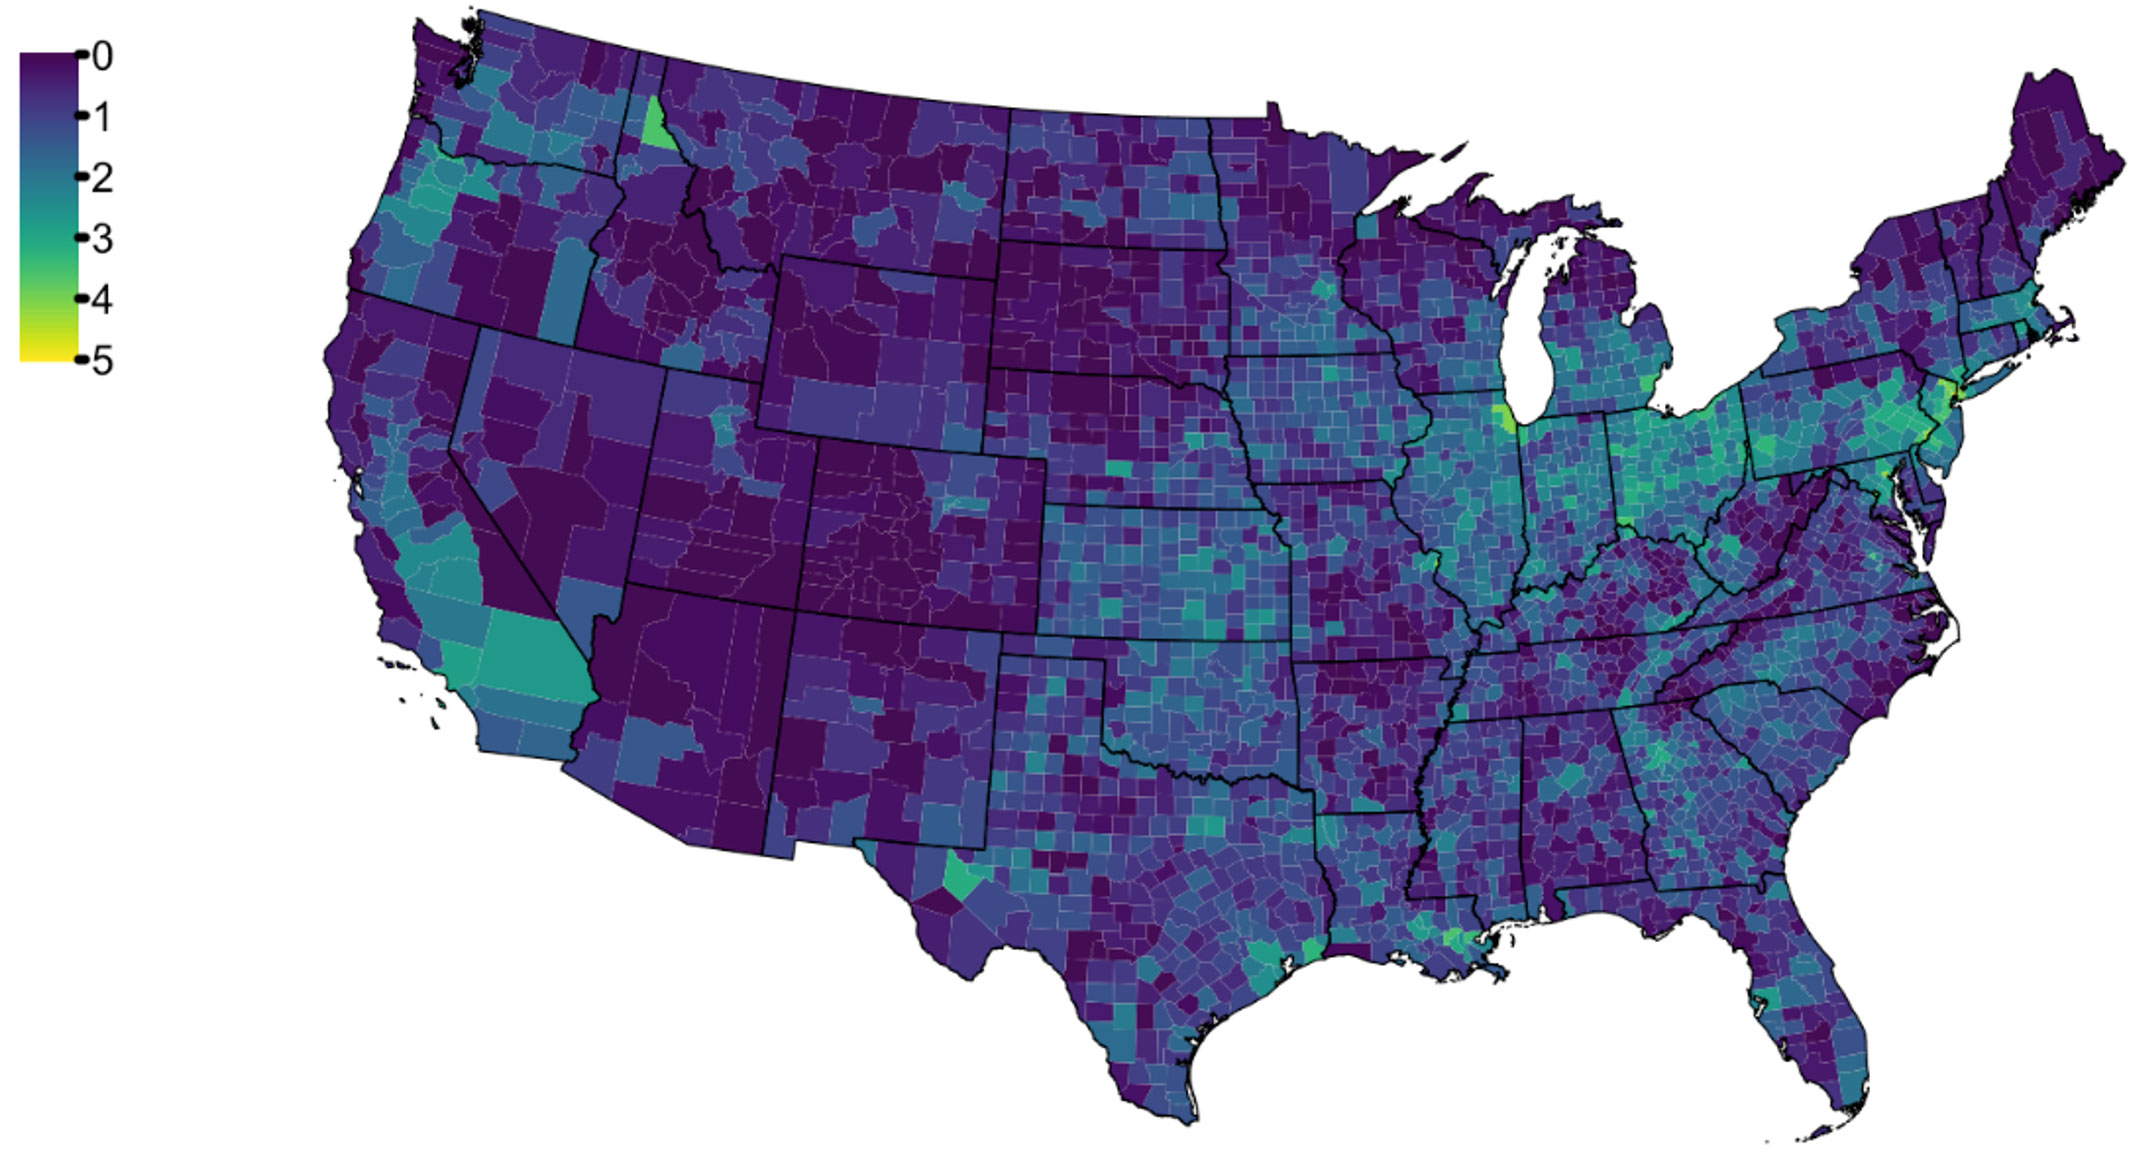
Figure 1. ICE Environmental Hazard Scores of counties within the conterminous United States. (Source: ICE Climate as of 11/27/24)
Taking a closer look at the state of Pennsylvania, the areas near the cities of Pittsburgh and Philadelphia appear to have significantly higher scores than some of the more rural areas of the state (Figure 2).
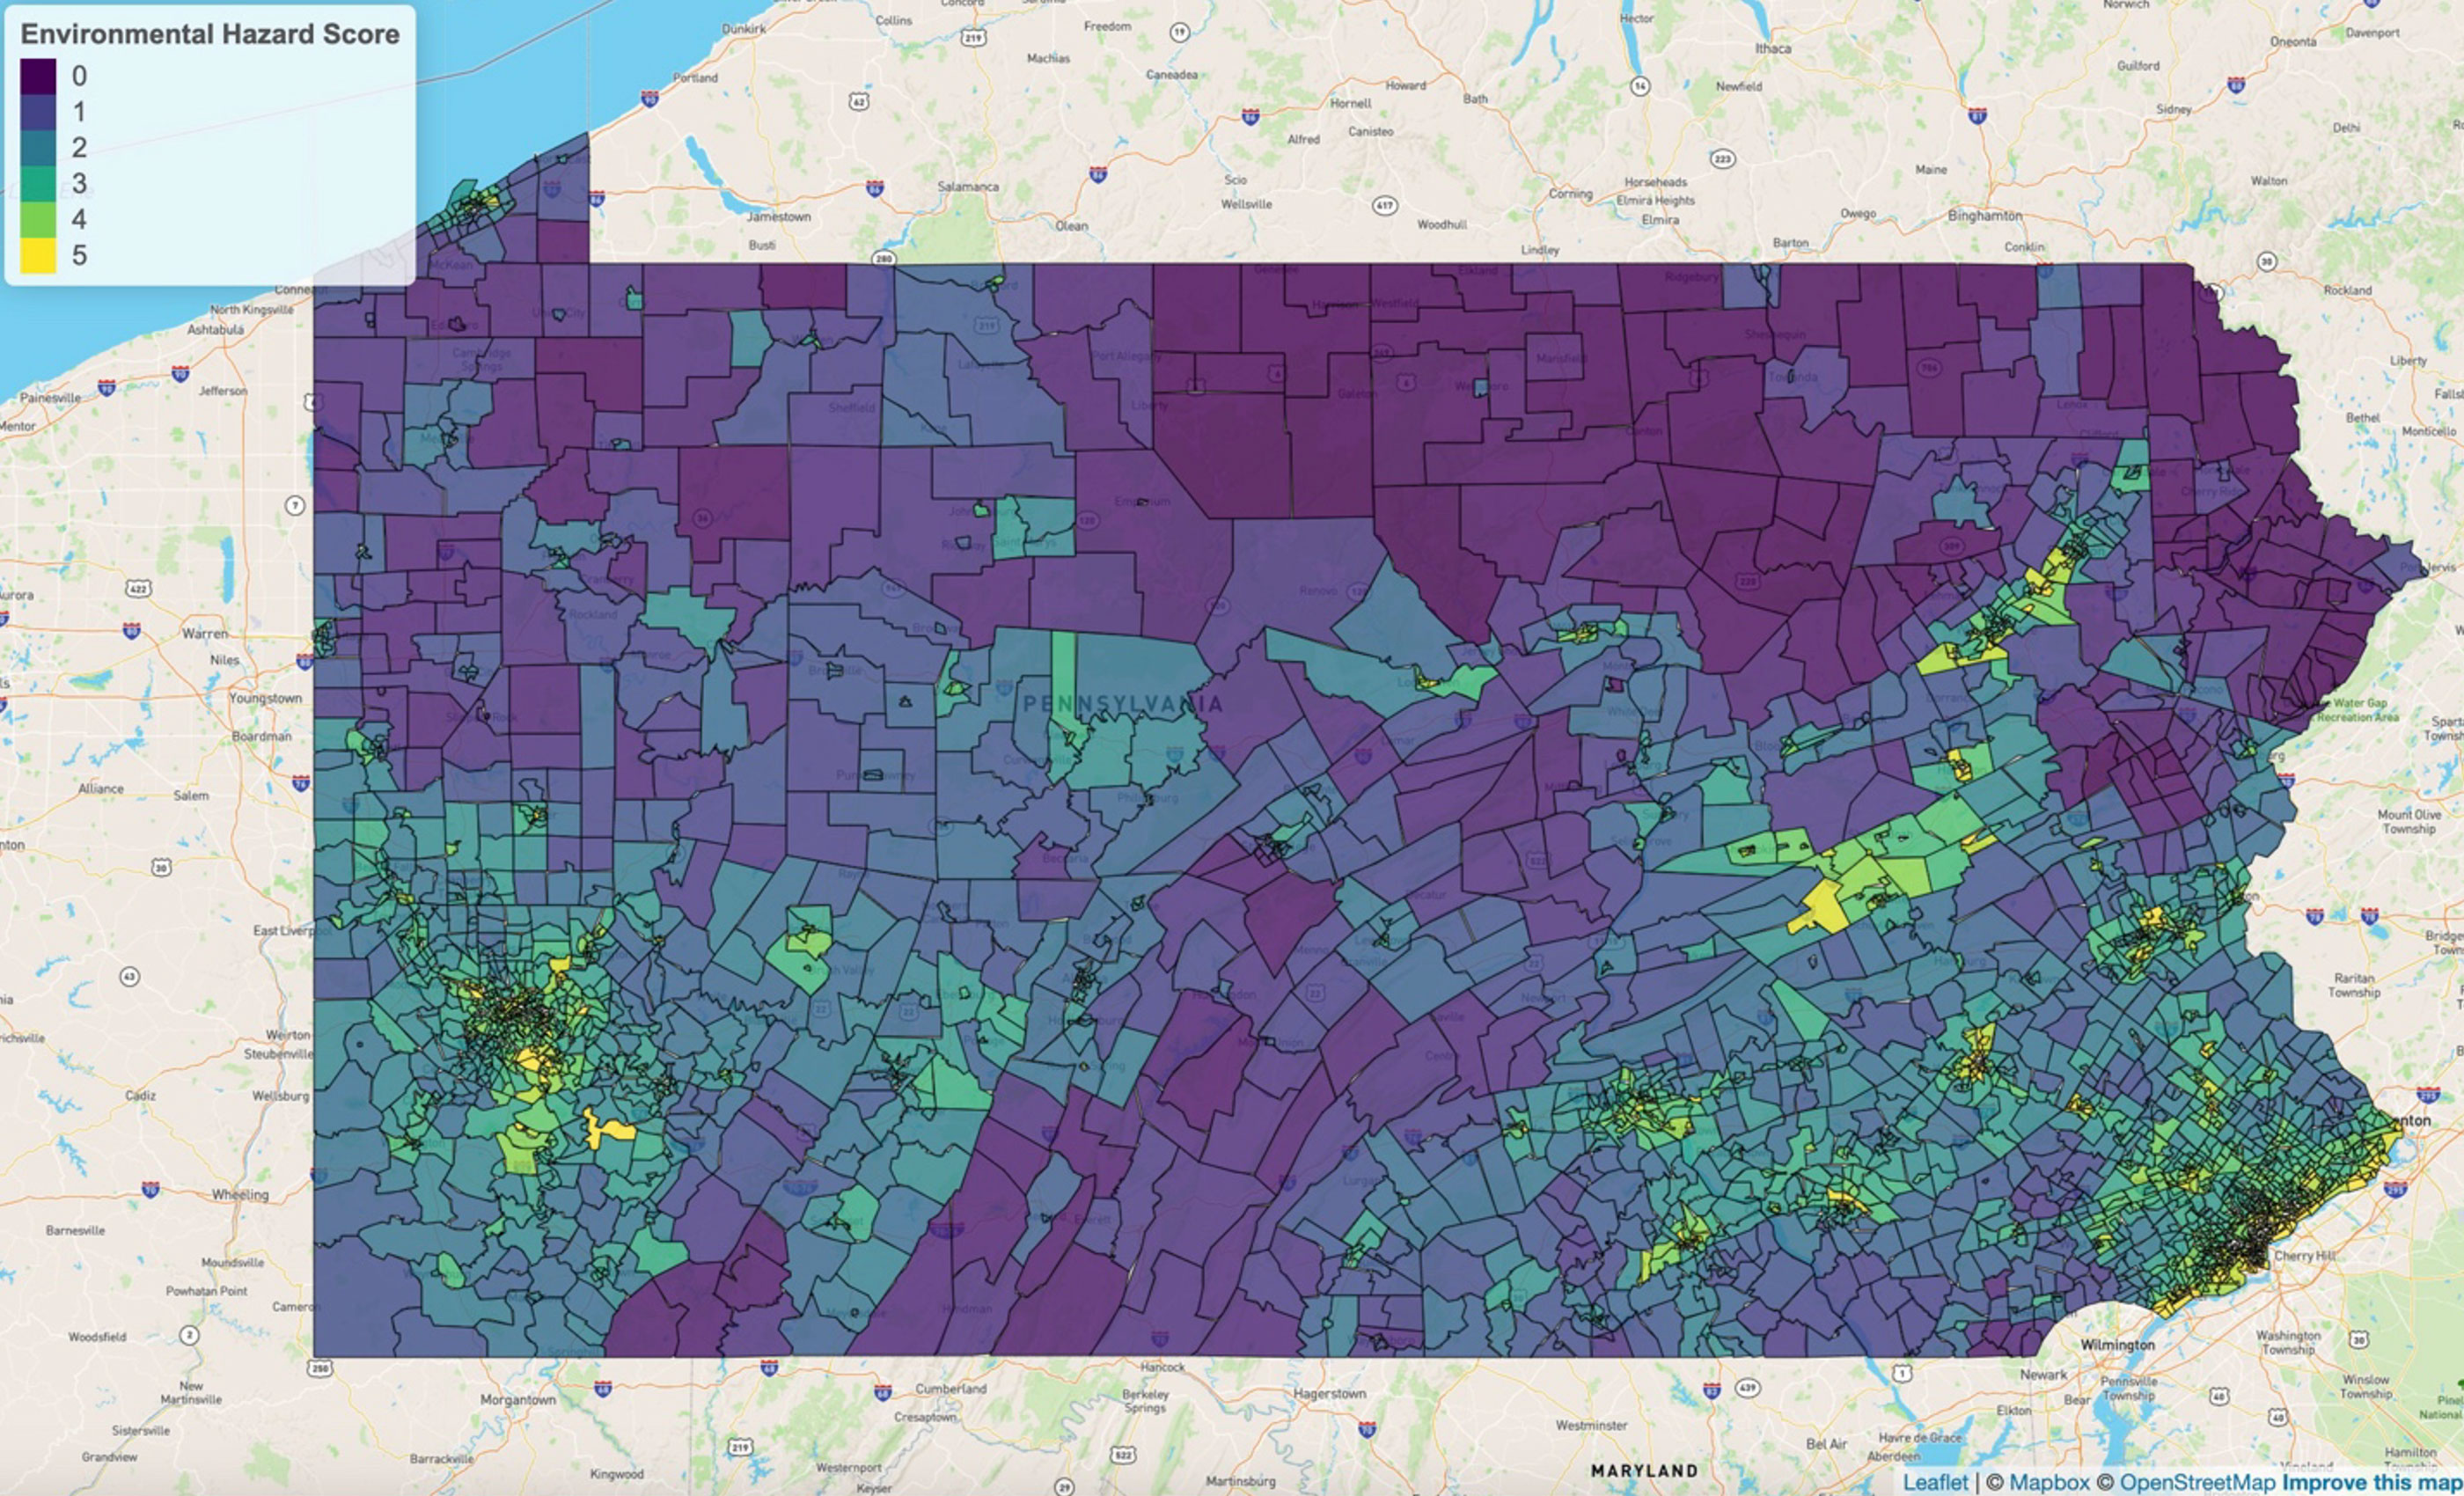
Figure 2. ICE Environmental Hazard Scores of census tracts across the state of Pennsylvania. (Source: ICE Climate as of 11/25/24)
Philadelphia County, which ranks high on the list of counties with the greatest prevalence of man-made environmental hazards,5 contains census tracts with some of the highest Environmental Hazard Scores, especially along the Delaware River (Figure 3). By 2015, counties making up the Philadelphia region had over 200 designated Superfund sites in various stages of cleanup; Philadelphia County had the most with 44.6 Air quality is also a major issue for this area — the city of Philadelphia is one of the nation’s worst areas for ozone and year-round particle pollution.7
In Chester, a neighboring city located in the Philadelphia metropolitan area, many residents live in pre-1980s housing stock in locations contaminated by a large number of industrial polluting facilities.8 One of the poorest cities in Pennsylvania, Chester filed for bankruptcy in 2022.9 For a city already dealing with extreme financial stress, the presence of environmental hazards is one more stressor that can lead to serious health and economic consequences for nearby communities over time.
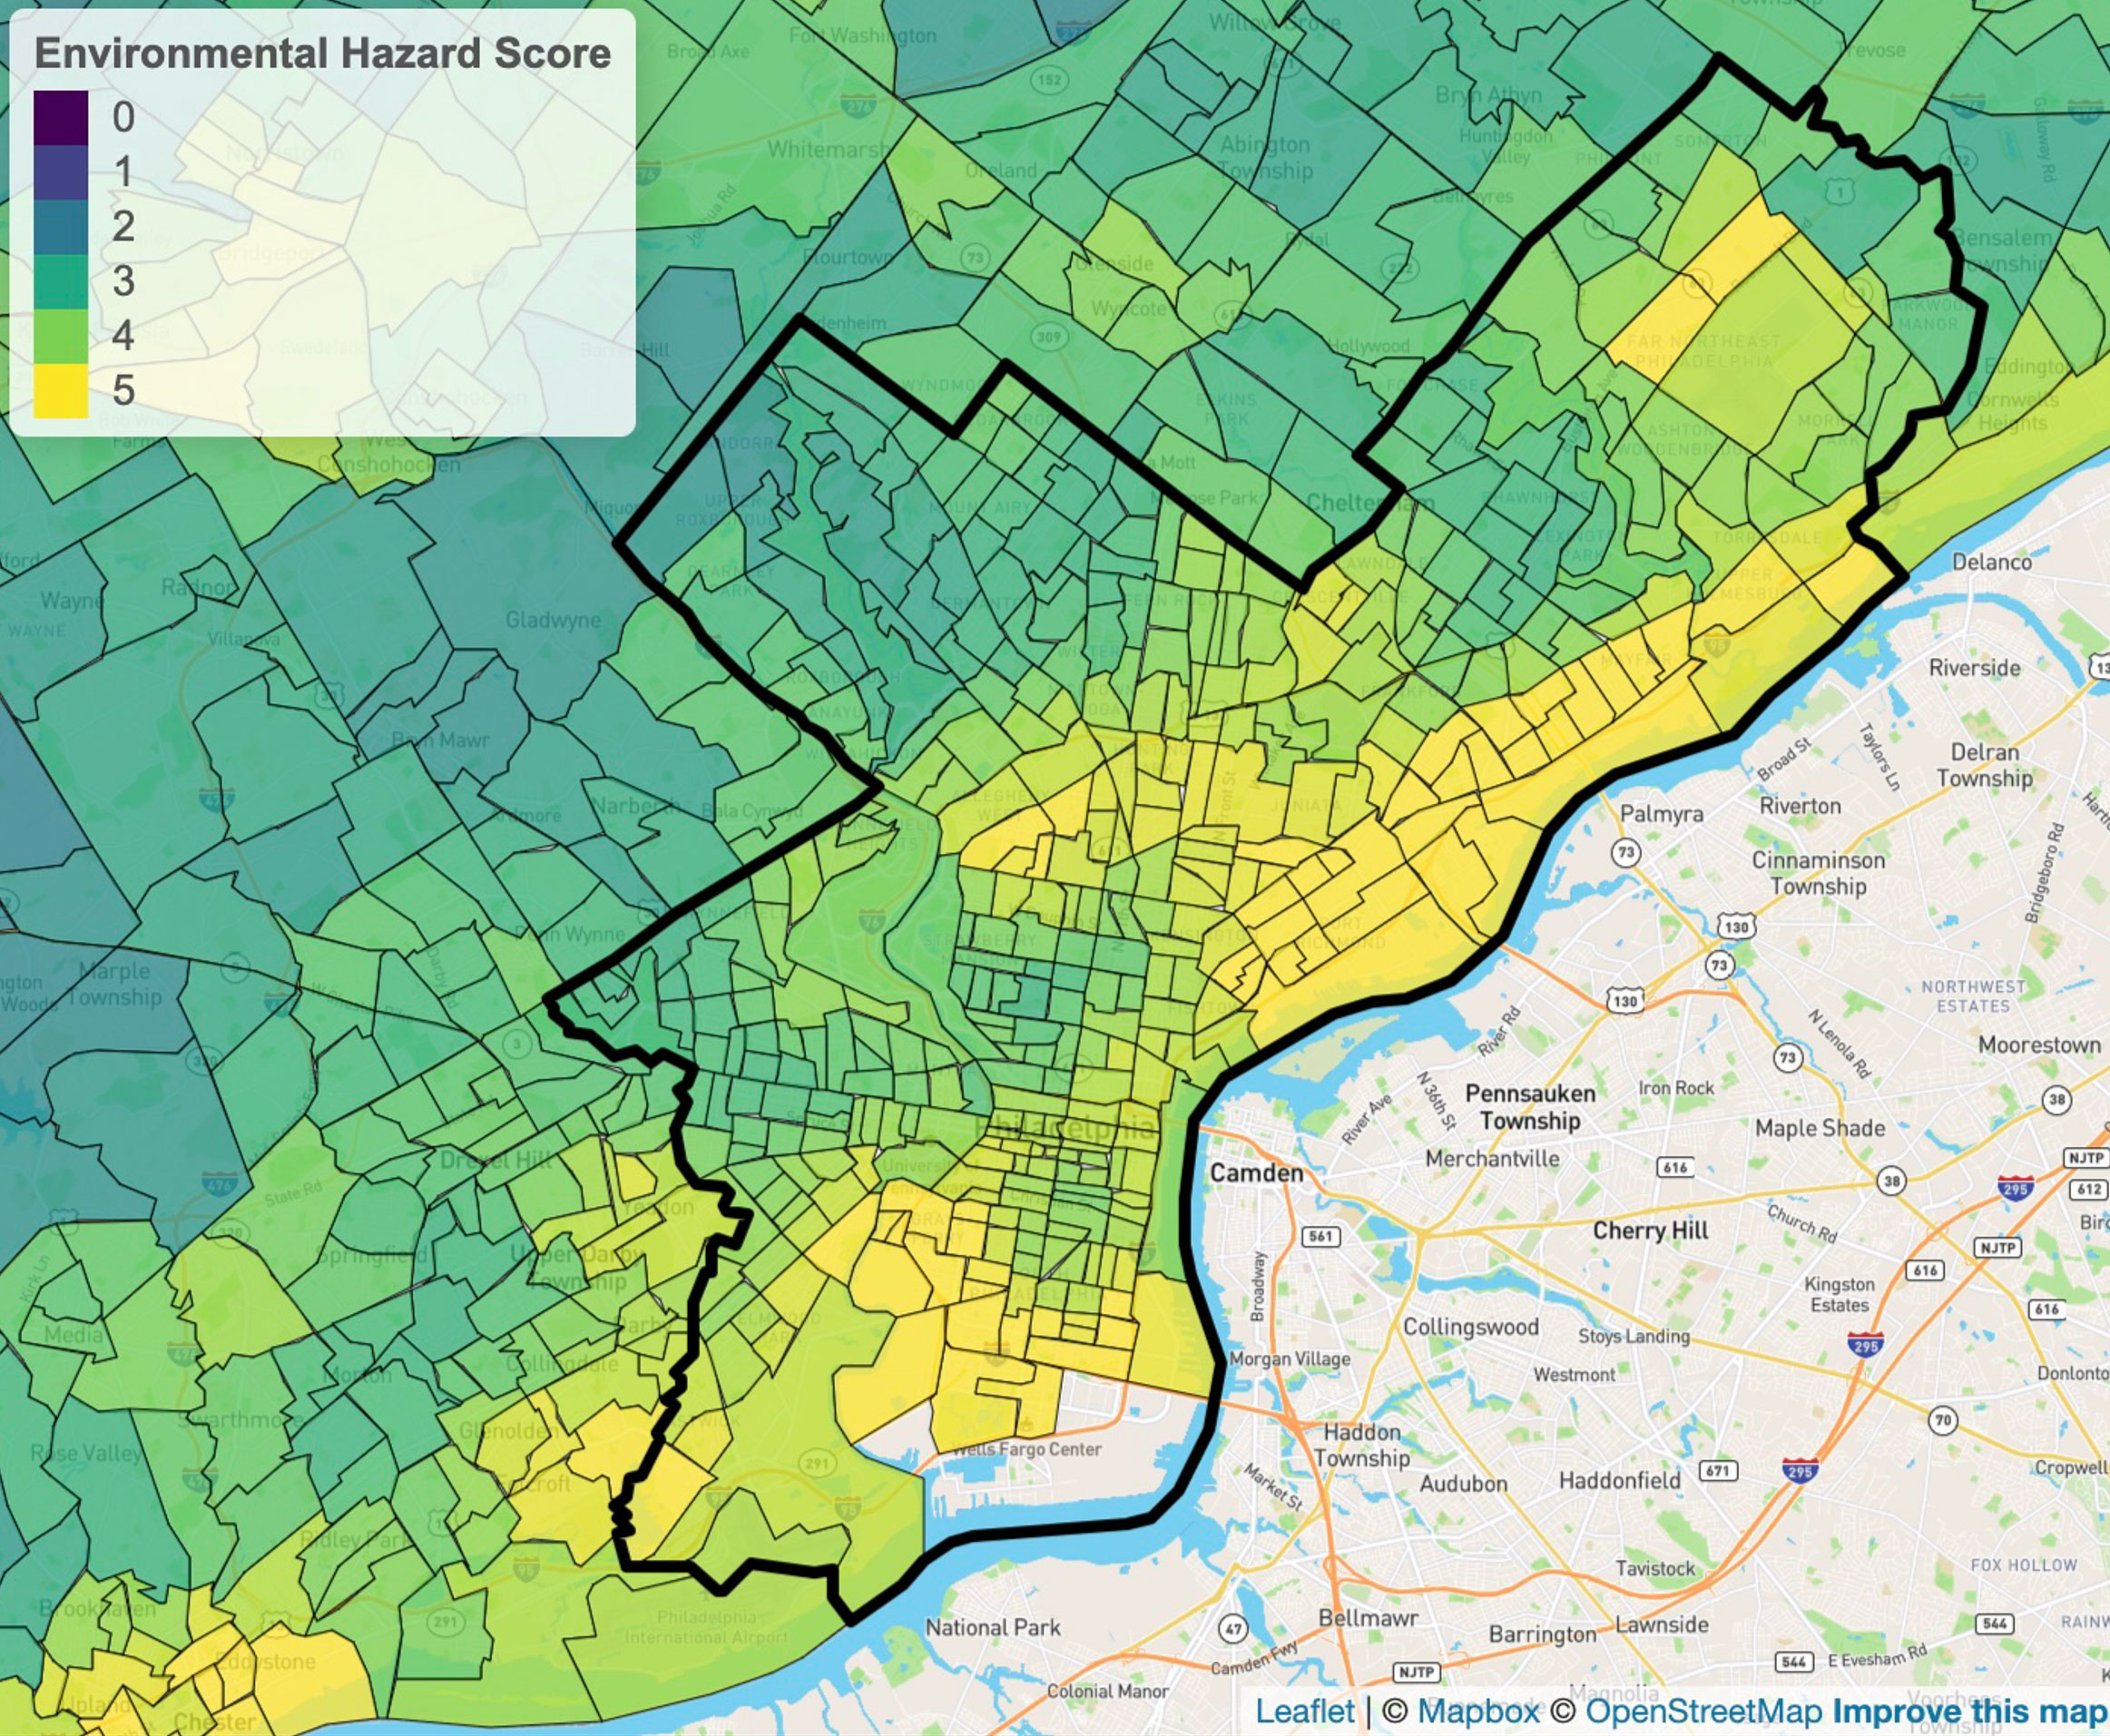
Figure 3. ICE Environmental Hazard Scores of census tracts within Philadelphia County. (Source: ICE Climate as of 11/25/24)
The ICE Environmental Hazard Score provides an assessment of the aggregate exposure to these kinds of environmental hazards in communities across the United States. In the municipal bond market context, this information may be useful in assessing risks and potential future costs for municipalities — as well as identifying the communities that could experience outsized benefits from investments in environmental cleanup and mitigation, green infrastructure and pollution-reducing projects.
1 Devries, P. (2023, April). Municipal bonds: Reducing pollution in minority communities. ICE. https://www.ice.com/insights/fixed-income-data/municipal-bonds-reducing-pollution-in-minority-communities
2 Warren, M. S., & Lewis, A. S. (2022, September 6). New Jersey’s Lenape Nation fights Ford’s toxic legacy. Science Friday. https://www.sciencefriday.com/segments/lenape-ford-waste-pollution/
3 Howitt, O. (2024, June 23). How traffic noise hurts children’s brains. BBC News. https://bbc.com/future/article/20240621-how-traffic-noise-pollution-harms-childrens-health-and-development
4 Presha, A., Scholsberg, J., Abramoff, M., & Pereira, I. (2024, February 2). East Palestine residents still displaced, suffering 1 year after toxic train derailment. ABC News. https://abcnews.go.com/US/east-palestine-residents-displaced-suffering-1-year-after/story?id=106863658
5 Carrión, A. (2014, September 23). Philly is #2 on counties with most environmental hazards list. Philadelphia Magazine. https://www.phillymag.com/property/2014/09/23/realtytrac-man-made-environmental-hazards/
6 Nepa, S. (2015). Superfund sites. Encyclopedia of Greater Philadelphia. https://philadelphiaencyclopedia.org/essays/superfund-sites/
7 Philly has an air pollution problem. These researchers think its neighborhoods may hold a solution. Villanova University Media Room. (n.d.). https://www1.villanova.edu/villanova/media/features/AirPollutionResearch.html
8 Chester. CEET: Center of Excellence in Environmental Toxicology. (n.d.). https://ceet.upenn.edu/community/target-communities/chester/
9 Farmer, L. (2023, January 10). A small city’s descent into bankruptcy. Route Fifty. https://www.route-fifty.com/finance/2023/01/chester-pennsylvania-bankruptcy-pensions-city-budget-finance/381645/