
Linking municipal bond securities to their geospatial footprints
Published
May 2024
By some estimates, over 90% of local and state capital spending is funded by municipal bonds in the United States.1 Cities, counties, administrative districts, states, and utilities across the country regularly issue these bonds to pay for everything from sewer systems to snowplows. General obligation bonds are secured by local taxes paid by the residents of obligated municipalities, while bonds issued by utilities are similarly secured by the revenues from customers in the utility’s service area. In both cases, each security can be linked to the specific geographic footprint of the obligor—whether it be a county, city, state, or service area (Figure 1).
Making these linkages is complicated by the fact that in many cases, the geospatial boundaries of obligors overlap. A security may also be obligated to more than one specific geospatial boundary (a bond issued by Hawaii, for example, would be linked to multiple distinct island boundaries). Some bonds are also issued by entities like the New York Dormitory Authority, though the obligated parties are specific school districts.
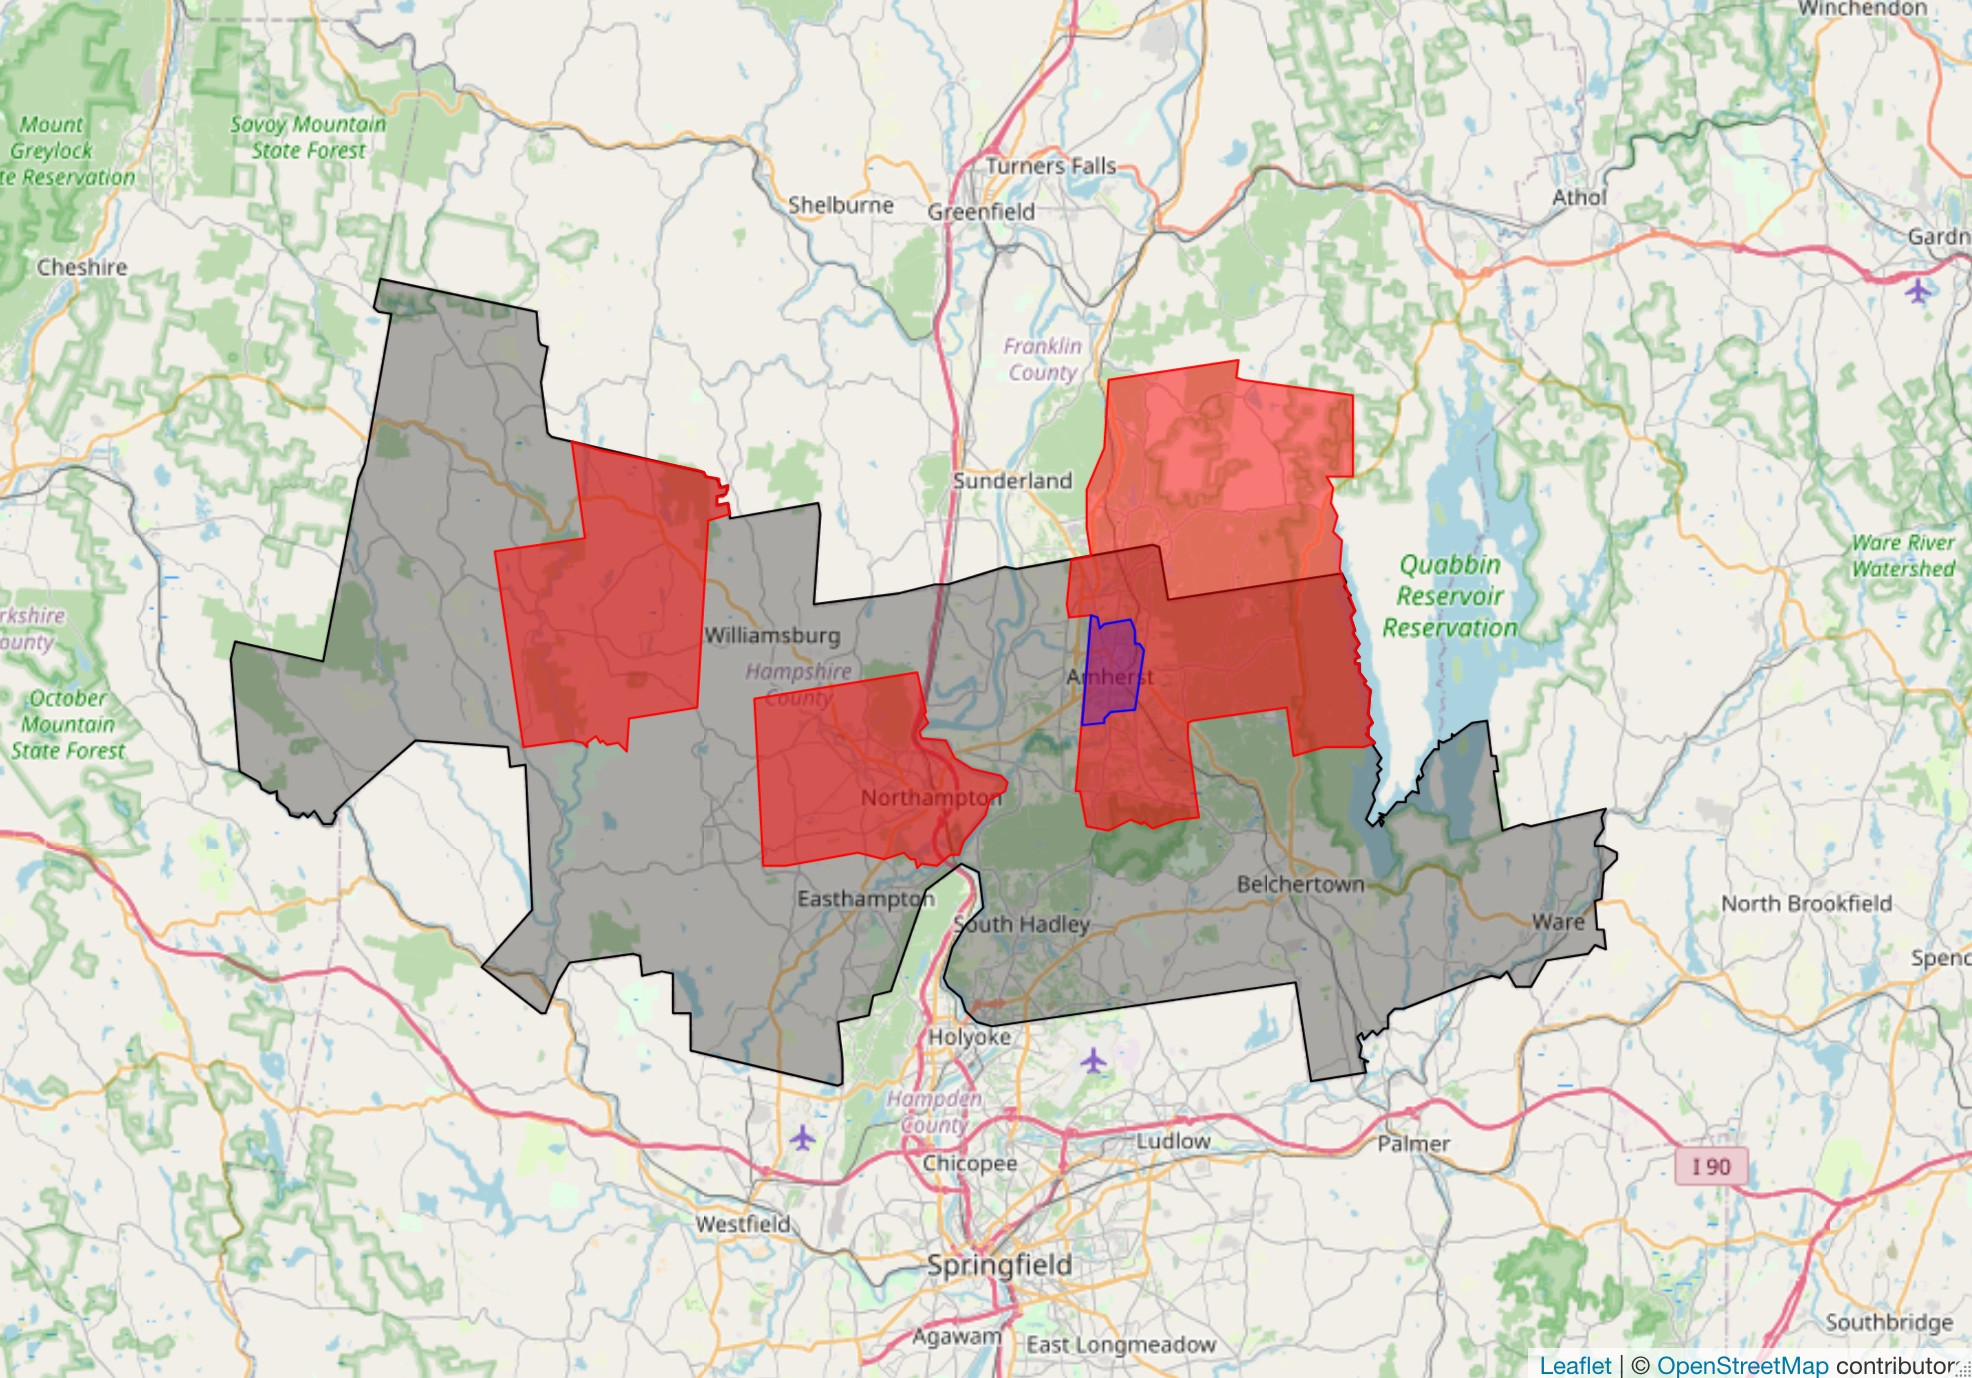
FIGURE 1. An example of overlapping municipal entities that may issue debt. The light grey area shows the boundaries of Hampshire County in Western Massachusetts. The red areas are three school districts that are contained in or overlap with Hampshire County: Chesterfield-Goshen School District on the west side of the County, Northampton in the center, and the Amherst-Pelham Regional School District in the east. The blue area is the Amherst Community Development District, a smaller municipal boundary that is wholly contained within both the Amherst-Pelham Regional School District and Hampshire County. Note that, to add an additional layer of complexity, the Amherst-Pelham Regional School District includes a substantial area of land that is not located in Hampshire County. Source: ICE Sustainable Finance as of 3/15/2024.
Over the past five years, ICE Sustainable Finance has created and curated a comprehensive geospatial library of municipal obligor tax and rate-payer boundaries. For county, city, school district, and state issuers, location boundaries are created by importing shapefiles from the U.S. Census. More complex boundaries—like those for utility service areas and community facilities districts (e.g., Figure 2, 3)—are either imported from existing shapefiles or created by ICE research analysts in QGIS, an open-source geographic information system software.
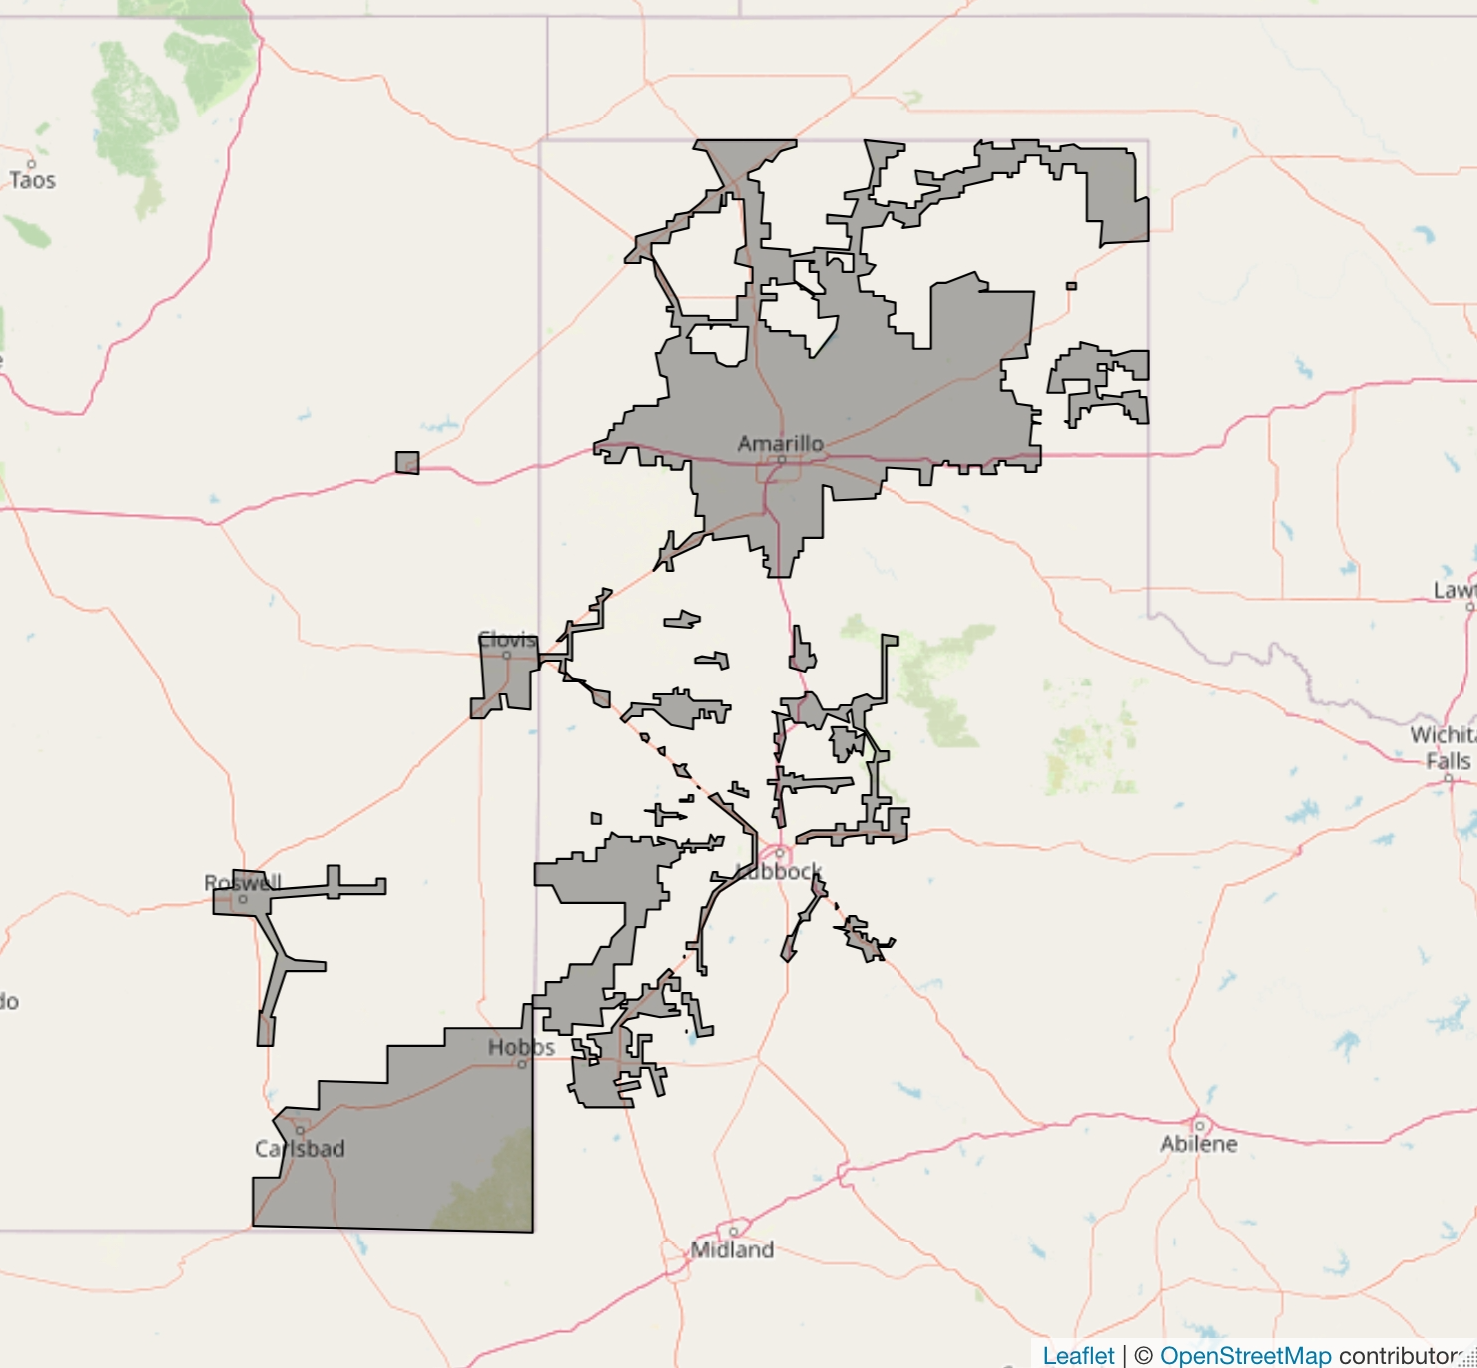
FIGURE 2. An updated boundary for the Southwestern Public Service Company in Texas. Source: ICE Sustainable Finance as of 3/15/2024.
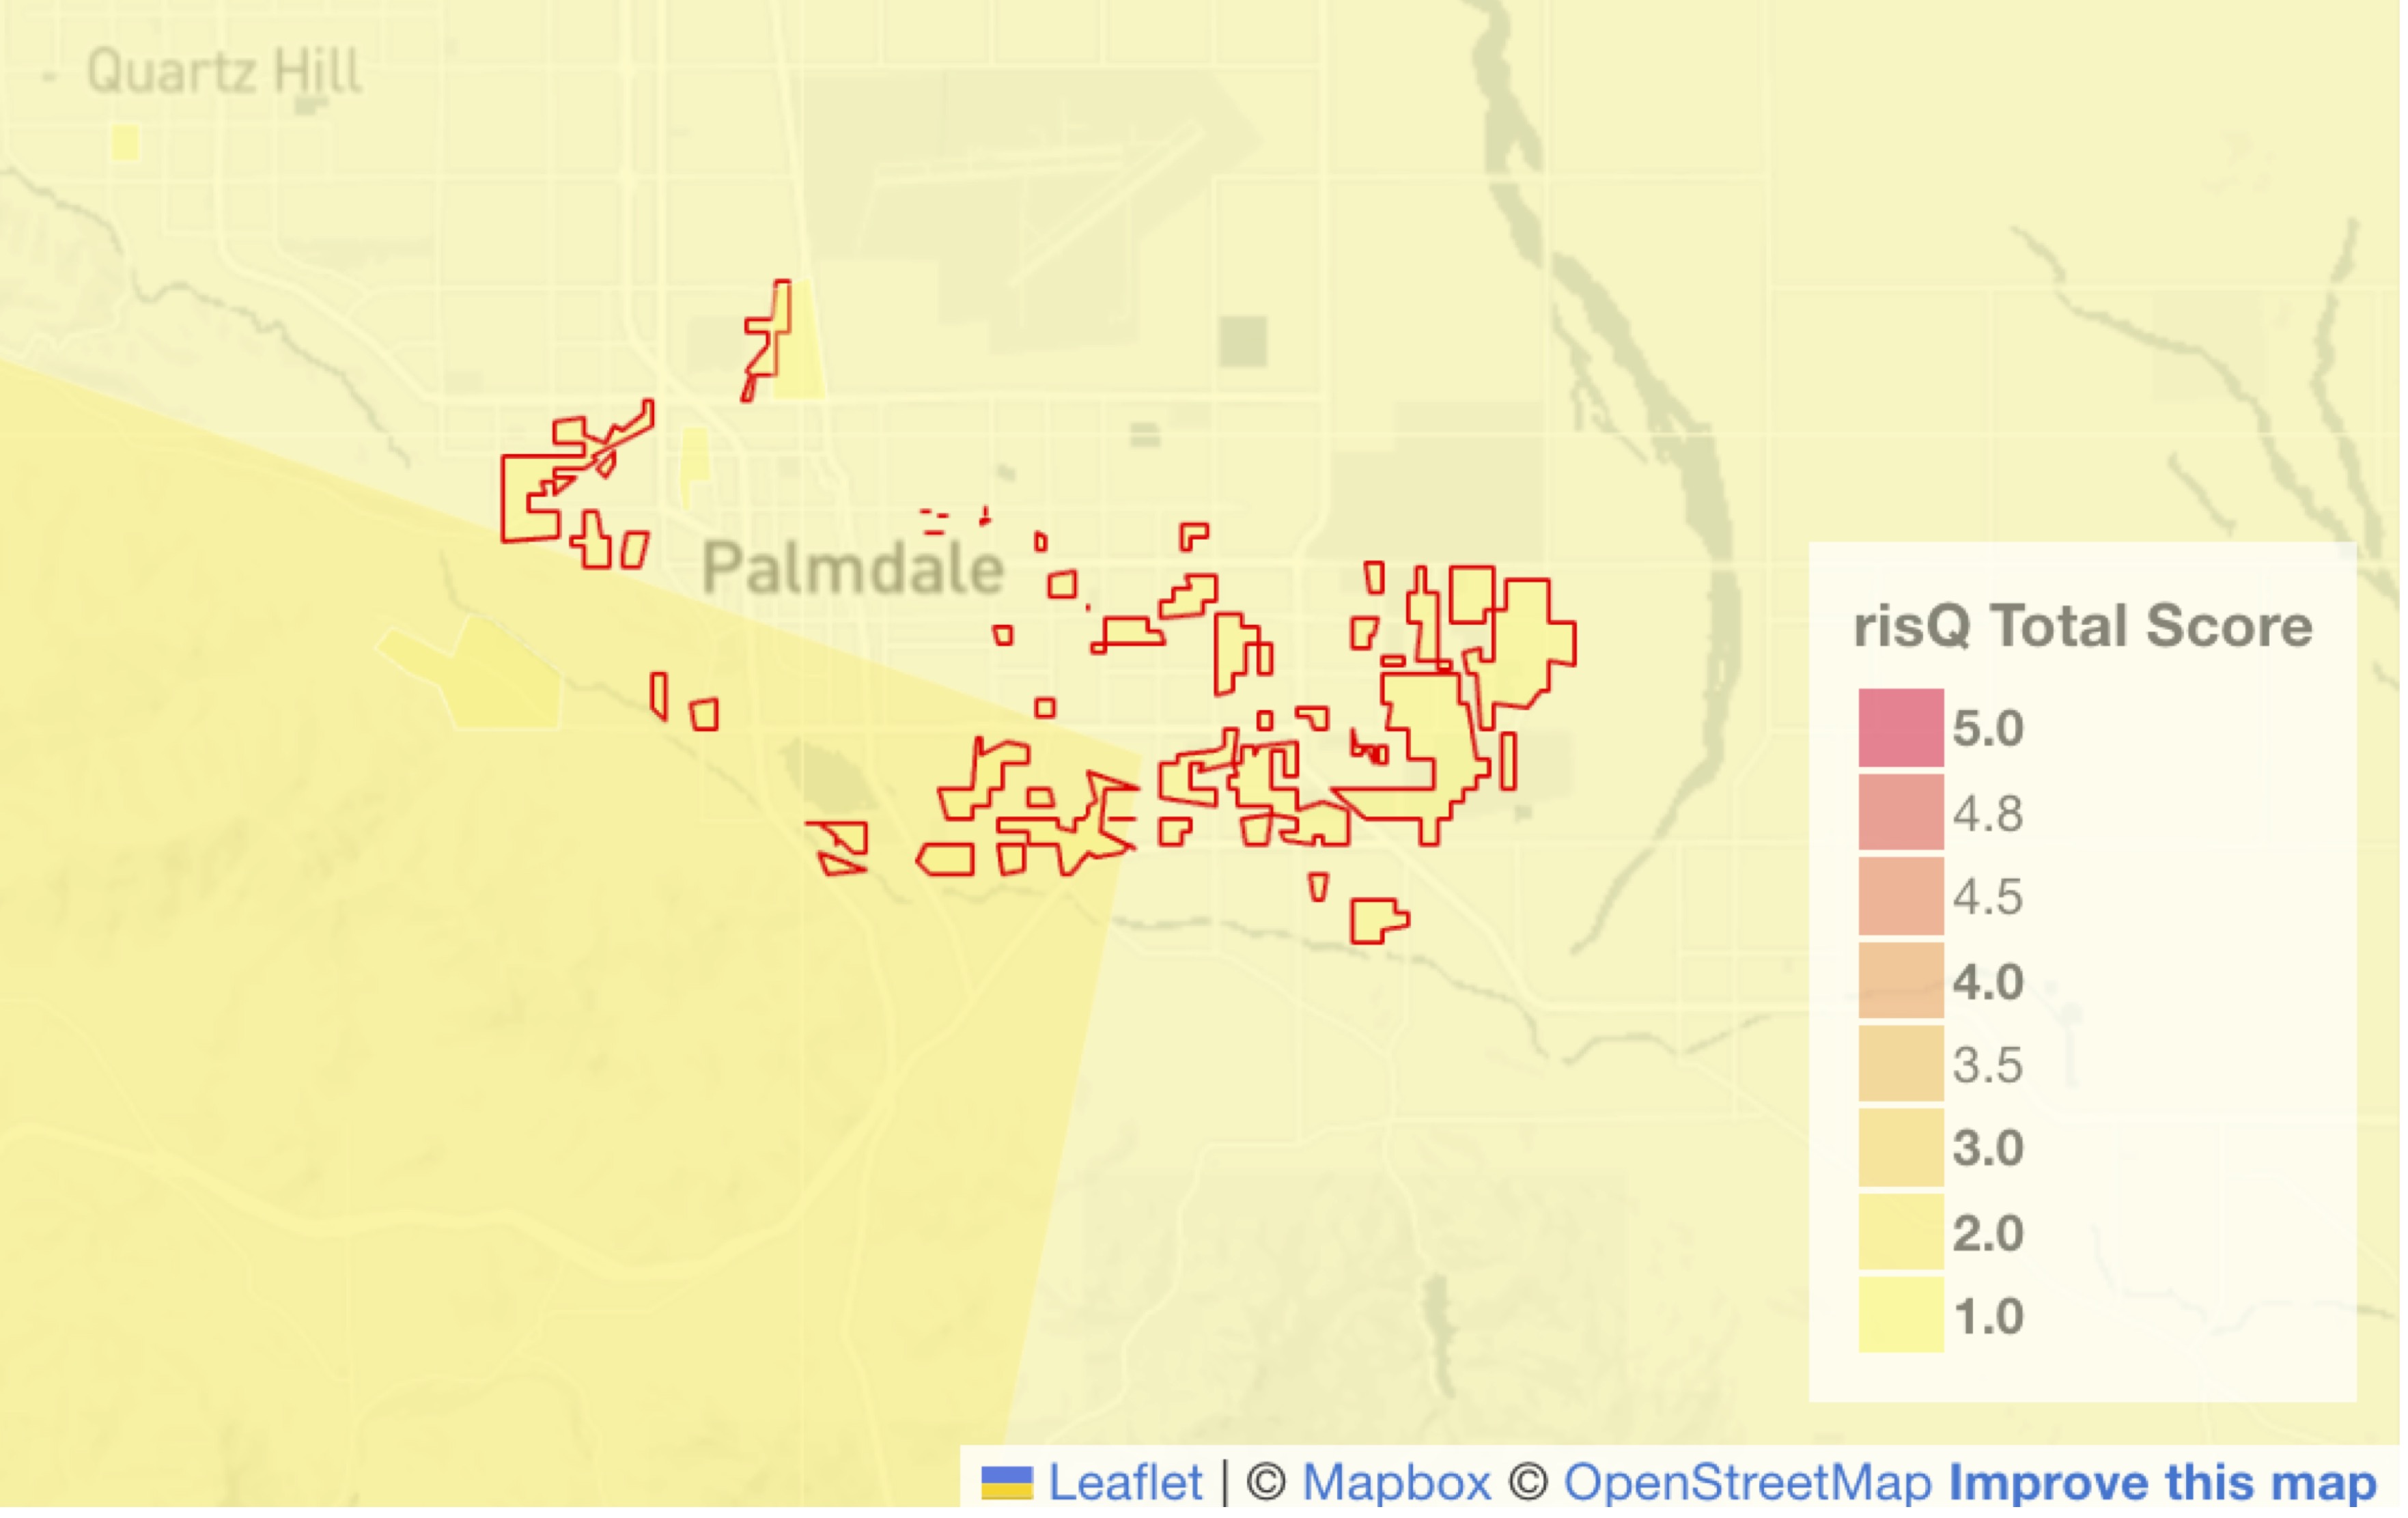
FIGURE 3. An updated boundary for a community facilities district in Palmdale, California with the ICE Climate Risk Score (risQ Score) included in shades of red. Source: ICE Sustainable Finance as of 3/15/2024.
Some obligors, like charter schools, housing developments, and hospitals, are geographically defined as points in the library. For these obligors, ICE Sustainable Finance calculates isochrones (the areas that could be reached by car) within different drive times from the obligor’s location. As one example, for a hospital revenue bond, the 30-min drive time isochrone could be seen as a reasonable ‘catchment area’ from which a hospital could draw patients (Figure 4). Boundaries can also be defined for toll authorities across the county (Figure 5).
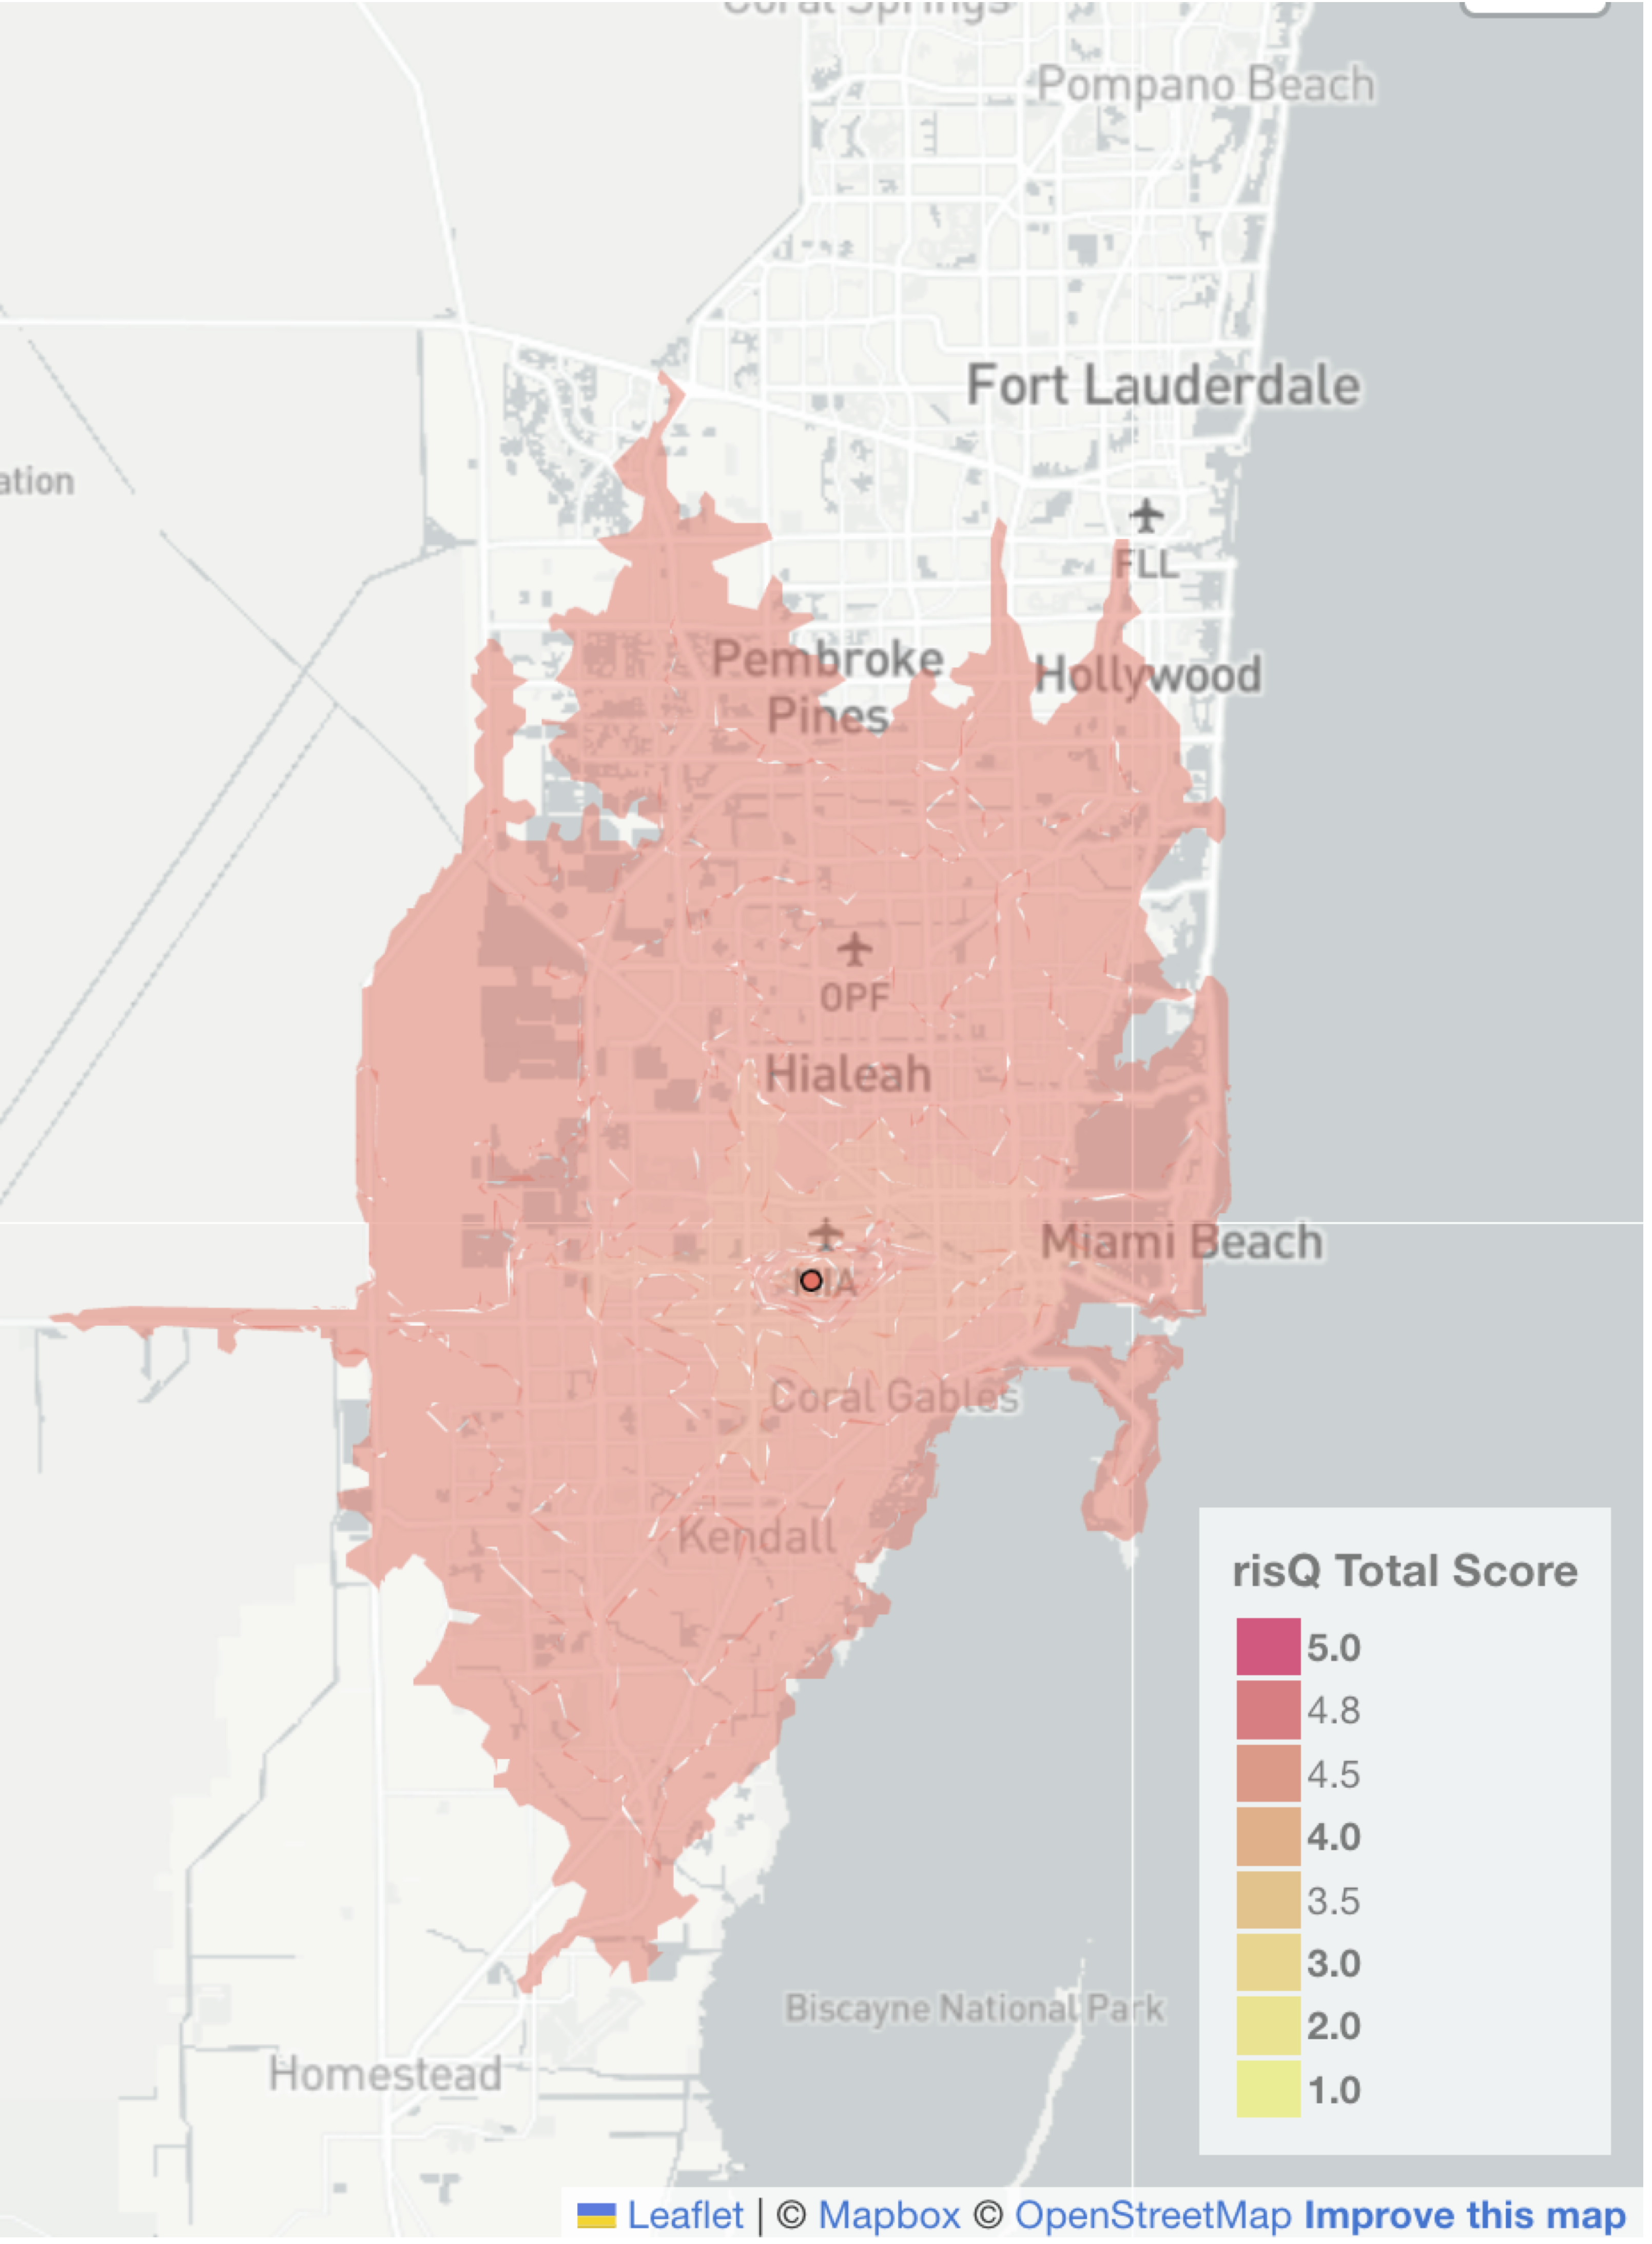
FIGURE 4. The 30-minute isochrone for Miami Medical Center in Miami, Florida. Source: ICE Sustainable Finance as of 3/15/2024.
FIGURE 5. Geographic boundaries (red) marking the areas within a 10-mile radius of all the Pennsylvania Turnpike’s ingress/egress locations, strung together into a chain. Source: ICE Sustainable Finance as of 3/15/2024.
While the municipal bond universe has nearly one million outstanding securities, the geospatial footprints of many of the obligors are the same. Large school districts and counties, for example, can often have dozens of outstanding securities with different maturity horizons. To provide accurate geospatial representations of obligors without having to save one geospatial footprint for every security, ICE Sustainable Finance’s geospatial library distills the municipal bond universe into the geographic footprints of unique pairs of issuers and obligors. The geographical footprints of these unique issuer-obligor pairs can in turn be linked to all their associated securities. As of April 2024, ICE Sustainable Finance’s geospatial library contained over 454,000 geospatial boundaries, with more than 29,000 of these boundaries linked to individual outstanding bonds. In total, ICE Sustainable Finance can link over 91% of municipal bond securities (in terms of dollars outstanding) to specific geospatial boundaries and our research team continues to build out the library every week based on new issuances and client requests.
The power and versatility of this geospatial library is difficult to understate. It enables a suite of different applications, including:
Overlapping debt burdens. ICE Sustainable Finance can use overlapping obligor boundaries and their associated outstanding CUSIPs to estimate the total debt burden of any given community. Approximations of the total debt burdens of a municipality are often provided by issuers in Official Statements, but ICE Sustainable Finance can calculate them directly.
Linkage to any spatial boundary of interest. ICE Sustainable Finance can link any spatial boundary of interest to CUSIPs with overlapping spatial footprints. For example, using the library, ICE Sustainable Finance could query for all the CUSIPs (and obligor boundaries) that overlap with the affected area of the 2023 East Palestine train derailment in Ohio.
Socioeconomic characteristics. Detailed information about the geographic boundary associated with a security allows ICE Sustainable Finance to provide CUSIP-level information about the socioeconomic characteristics of obligated communities.
Climate risk metrics. Detailed information about the geographic boundary associated with a security allows ICE Sustainable Finance to provide CUSIP-level information about the climate risk of obligated communities.
Generalizability. Though the ICE Geospatial Platform was built with climate and social data in mind, it could be used to examine the relationship between securities and any kind of spatial data.
1 Marlowe, J (2015). Municipal Bonds and Infrastructure Development—Past, Present, and Future. Whitepaper, International City/County Management Association (ICMA) and Government Finance Officers Association (GFOA). Link
2 As of Feb 1, 2024
Limitations
This document contains information that is proprietary property of Intercontinental Exchange, Inc. and its affiliates (“ICE Group”) and is not to be published, reproduced, copied, disclosed or used without the express written consent of ICE Group.
This document is provided for informational purposes only. Nothing herein should in any way be deemed to alter the legal rights and obligations contained in agreements between ICE Group and its clients relating to any of the products or services described herein. Nothing herein is intended to constitute legal, tax, accounting or other professional advice.
The information contained herein is provided “as is.” ICE makes no warranties whatsoever, either express or implied, as to merchantability, fitness for a particular purpose, or any other matter. Without limiting the foregoing, ICE Group makes no representation or warranty that any data or information (including but not limited to evaluations) supplied to or by it are complete or free from errors, omissions, or defects.
All values included in the products and services described herein are estimates, including those values that are derived using data provided by other data providers as well as forecasts of expectations of change. Such estimates are based upon information available to ICE Group at the time of calculation, are provided as is, and should be treated as estimates and forecasts with potentially substantial deviations from actual outcomes, regardless of whether such features are explicitly described in any data dictionary, methodology, or definition as estimates or forecasts.
ICE Group is not registered as a nationally registered statistical rating organizations, nor should this document be construed to constitute an assessment of the creditworthiness of any company or financial instrument. Analytics available from ICE Group should not be considered an analyst’s opinion of the underlying investability of a particular location or security. No part of this service should be construed as providing investment advice.
Trademarks of Intercontinental Exchange, Inc. and/or its affiliates include: Intercontinental Exchange, ICE, ICE block design, NYSE, ICE Data Services, ICE Data and New York Stock Exchange. Information regarding additional trademarks and intellectual property rights of Intercontinental Exchange, Inc. and/or its affiliates is located at www.intercontinentalexchange.com/terms-of-use. Other products, services, or company names mentioned herein are the property of, and may be the service mark or trademark of, their respective owners.
© 2024 Intercontinental Exchange, Inc.