
Monitoring hazard events
Amid growing evidence that climate events can impact financial markets, how can participants assess risk?
Published
June 2024
Over the past decade, communities across the world have experienced disruptions due to extreme weather and natural disasters, including floods, droughts, tornados, wildfires, and hurricanes. These kinds of events have the potential to affect every sector of the economy. Storms often do significant damage to property and infrastructure, which in turn impacts the insurance industry; healthcare systems may experience heavy patient loads under extreme heat conditions; tourism may decrease in the wake of hurricanes; and entire harvests may be lost due to extreme flooding and drought events. In some cases, entire communities have been forced to permanently move.
The impacts of extreme weather and natural disasters extend to financial markets. There is evidence, for example, that municipal bond yields in the United States tend to be higher after major floods in unexpected locations1. In Florida, hurricanes have also been associated with long-lasting and disparate effects on housing markets and patterns of home ownership.2 These effects are also observed globally: major storms and natural disasters can increase sovereign default premiums3 and even the likelihood of sovereign default.4
Under realistic emissions scenarios, the frequency and severity of extreme weather events are projected to worsen, and communities around the world will likely face more weather-related disruptions. These disruptions will in turn likely have significant implications for the interconnected financial markets — residential housing, commercial real estate, corporate, sovereign, and municipal debt, among others — that tie us all together.
To inform market stakeholders about extreme weather and other hazards in real time, ICE Sustainable Finance monitors forecasted, observed, and historical hazard events data from the National Weather Service and other sources.
Case study: Flood and hurricane maps from the National Weather Service over a six-month period
Between July 1, 2023, and December 31, 2023, there were over 600 observed alerts — based on observations, rather than forecasts — for floods and hurricanes across the 48 contiguous states.
FIGURE 1. (Animation) National Weather Service flood and hurricane alert locations (observed, not forecasted) between July 1, 2023, and January 1, 2024.
New England experienced some of the most frequent and widespread flood alerts during this six-month period. In Vermont during July, rainfall amounts broke local records and resulting floods killed two people and destroyed infrastructure.5 Significant portions of the state capital were underwater; months later in January 2023, local businesses remained closed as recovery efforts continued. In mid-December, another storm swept the Northeast, cutting power for over 800,000 customers along the eastern seaboard.6 In late August, Hurricane Idalia caused significant flooding as it cut across Northern Florida, Georgia, and the Carolinas.
FIGURE 2. (Animation) National Weather Service flood and hurricane alert locations (observed, not forecasted) between July 1, 2023, and January 1, 2024 for New England states. Source: ICE Sustainable Finance as of 05/24/2024.
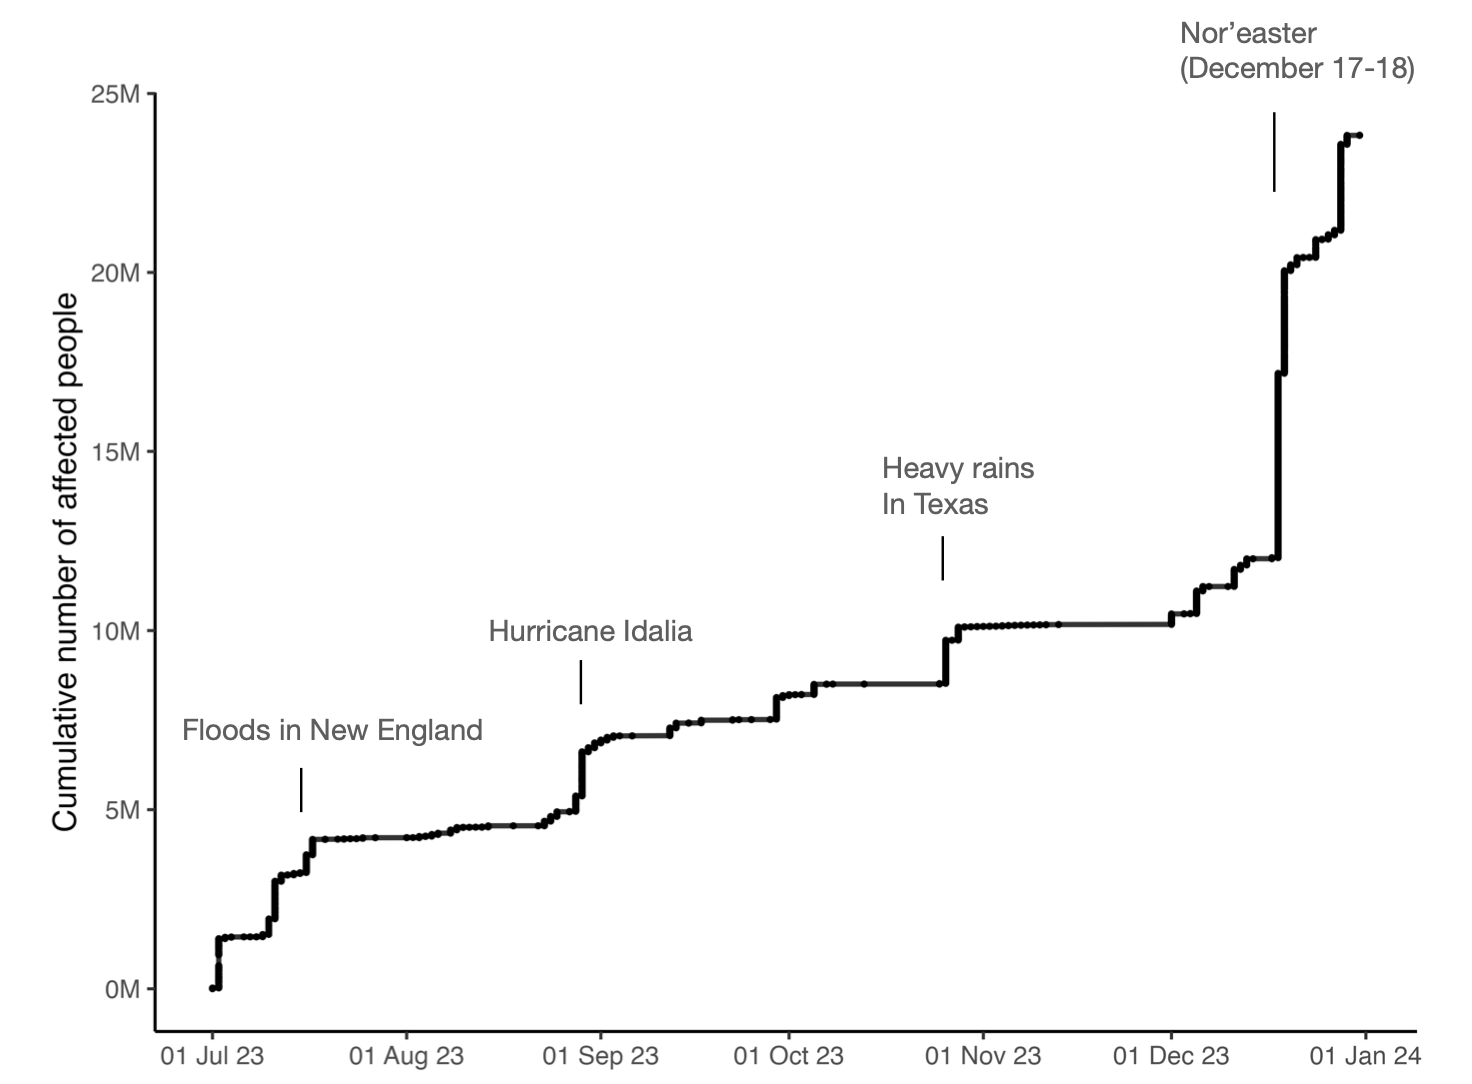
FIGURE 3. Cumulative number of people in areas under observed hurricane and flood alerts from the National Weather Service between July 1, 2023, and January 1, 2024. Source: ICE Sustainable Finance as of 03/27/2024.
On a state-by-state basis, Georgia had the largest total area under observed hurricane or flood alerts due to Hurricane Idalia.
Georgia ranks highest for total area affected by flood and hurricane alerts
FIGURE 4. The 10 states with the largest total area under observed flood and hurricane alerts from the National Weather Service between July 1, 2023, and January 1, 2024. Source: ICE Sustainable Finance as of 03/27/2024.
However, to understand the scale of potential damage that may be caused by any event, it is important to quantify more than just the affected area. While Georgia had the largest total area affected over this period, the total number of people affected was highest in New Jersey, Connecticut, and Pennsylvania. (Figure 4).7
New Jersey had the largest number of affected people
FIGURE 5. The 10 states with the largest numbers of people in areas under observed flood and hurricane alerts from the National Weather Service between July 1 2023 and Jan 1 2024. Source: ICE Sustainable Finance as of 03/27/2024.
These exposure differences arise from differing population densities of the affected locations. In places like Connecticut, the National Weather Service issued flood alerts for the entire Connecticut River corridor, an area that included Greater Hartford and its mid-sized international airport. Alerts were also issued for the mid-sized city of Danbury in the western half of the state. In Georgia, by contrast, a significant number of alerts with large geographical footprints were issued in less populous areas.
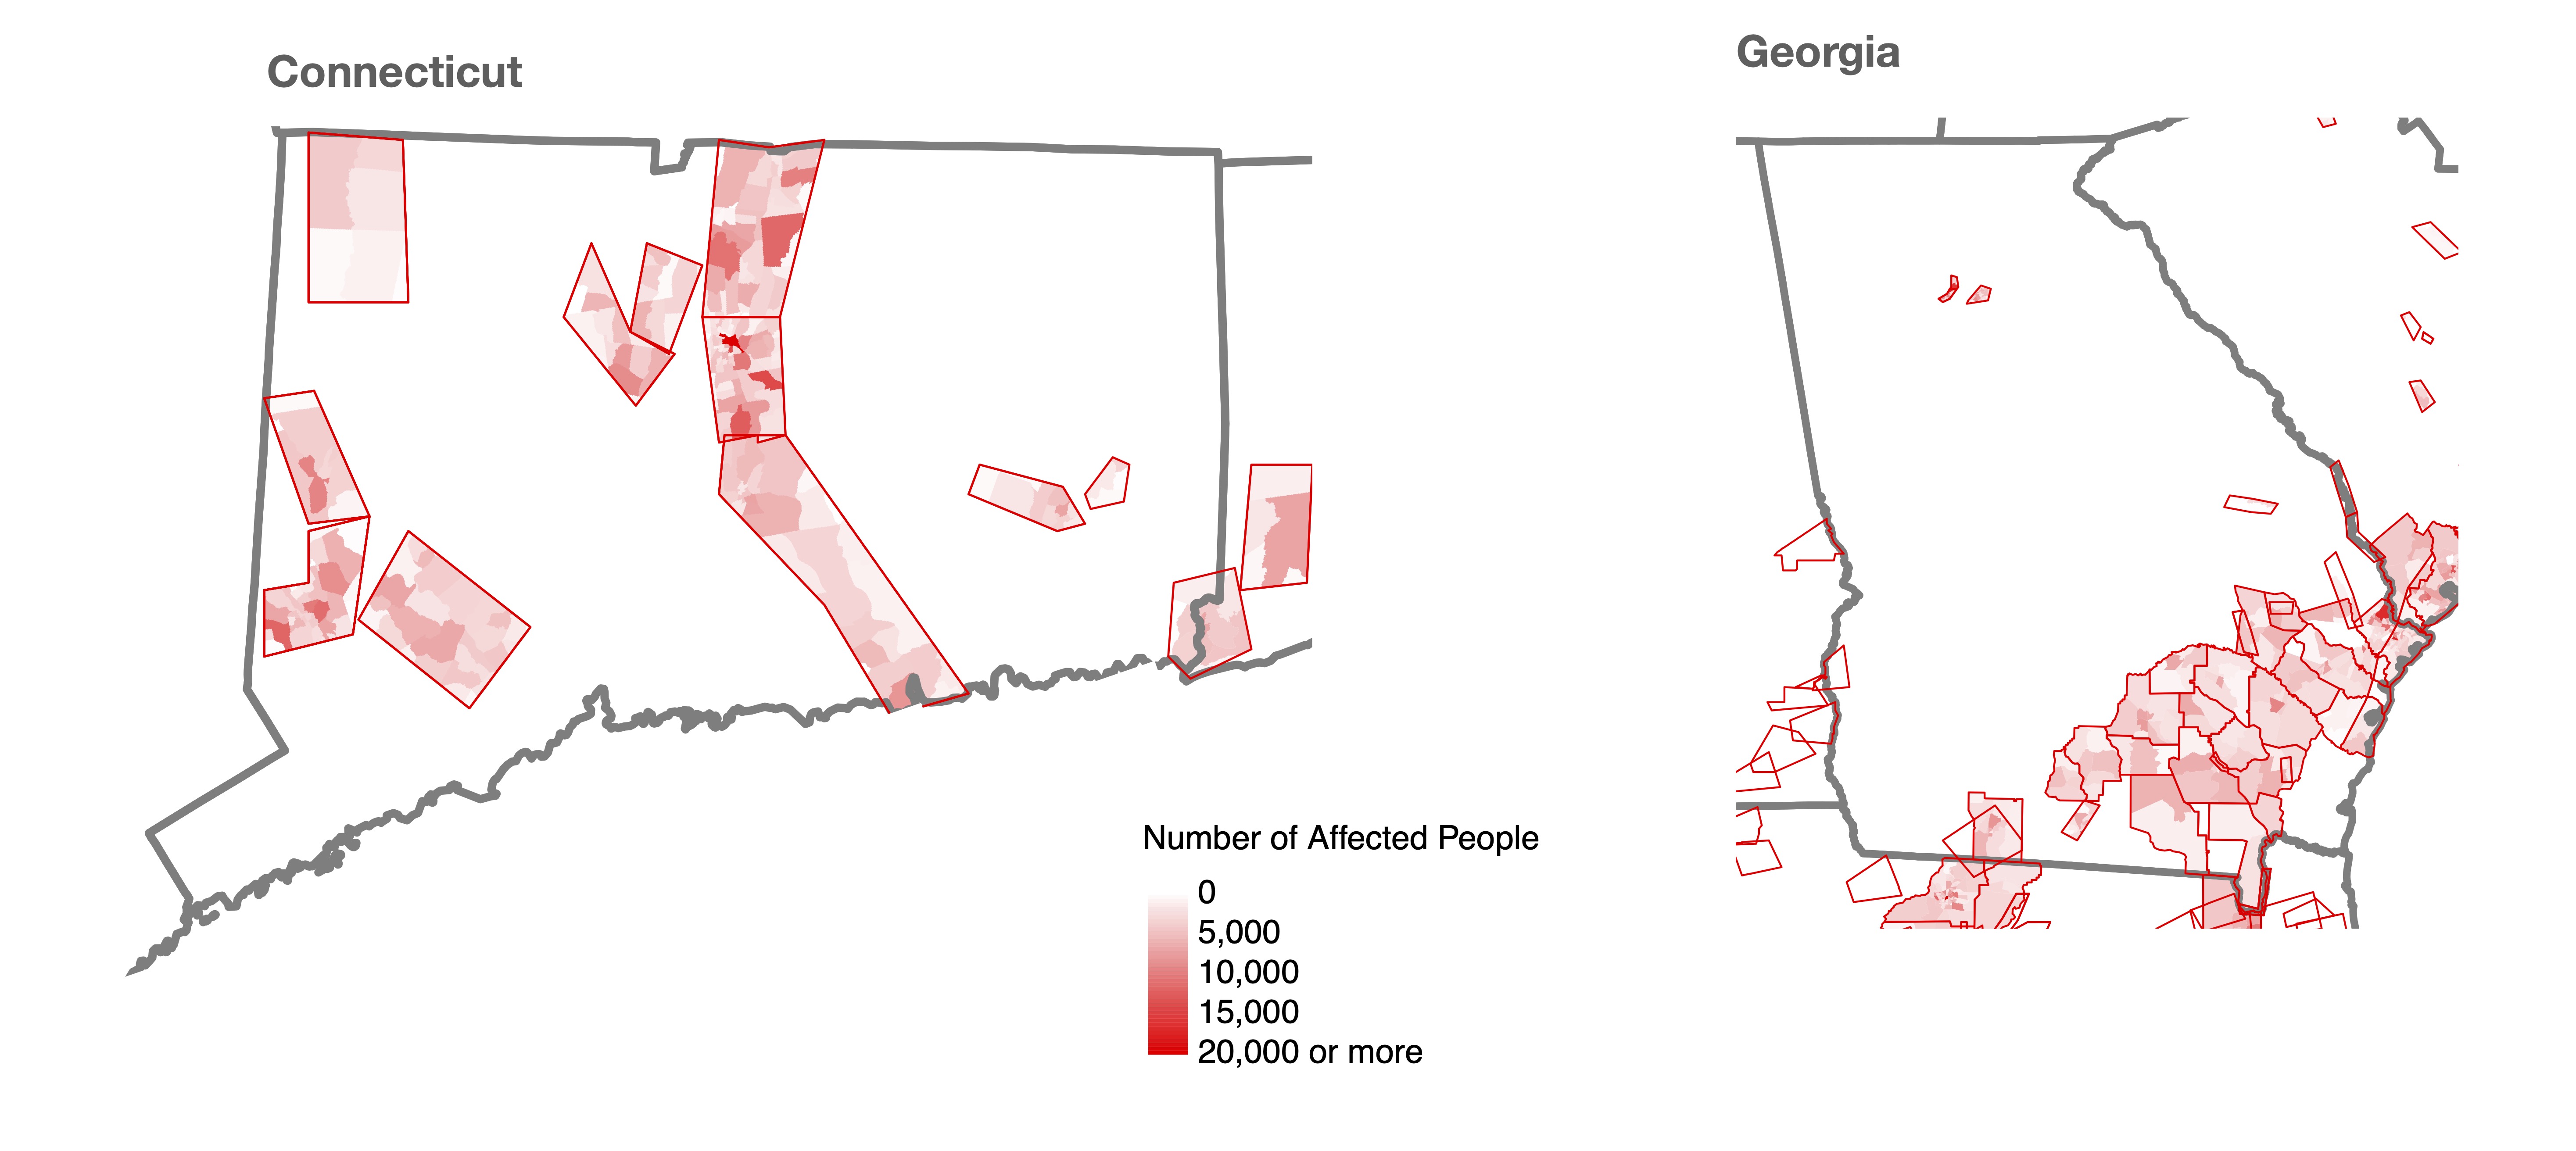
FIGURE 6. Maps of the National Weather Service alert locations of this six-month period (red) along with affected areas of census tracts across the states, shaded by the number of people affected. Source: ICE Sustainable Finance as of 03/27/2024.
In terms of infrastructure, over this same period, Pennsylvania had the largest number of built structures in areas under flood and hurricane alerts. But in terms of the estimated value of infrastructure in these areas, Connecticut ranked highest.
Connecticut ranks highest for the value of affected structures
FIGURE 7. The 10 states with the value of the structures in areas under flood and hurricane alerts from the National Weather Service between July 1, 2023, and January 1, 2024. Source: ICE Sustainable Finance as of 03/27/2024.
These state-by-state patterns of exposure (Figure 3-6) are complex: over the same six-month period, Georgia has the largest total area under flood and hurricane alerts, New Jersey the largest affected population, Pennsylvania the largest number of affected buildings, and Connecticut the largest total value of affected buildings. This complexity underscores the importance of integrating information about where these alerts are happening with information about what is exposed in those locations.
Of course, floods and hurricanes are not the only hazards that affect communities and markets around the world. ICE Sustainable Finance also incorporates alerts for other hazard types within the United States from the National Weather Service (like tornados; Figure 7) as well as global disaster alerts form the Global Disaster Alert and Coordination System. At the global scale, active alerts from GDACS include wildfire, flood, volcano, drought, earthquake, and hurricane alerts. For a historical perspective, ICE Sustainable Finance also integrates historical GDACS alerts (2002-present) and the National Oceanographic and Atmospheric Administration HURDAT2 historical hurricane database into the geospatial platform (1851-2002).
FIGURE 8. (Animation) National Weather Service tornado alerts (observed, not forecasted) between November 1, 2023, and January 1, 2024. Source: ICE Sustainable Finance as of 03/27/2024.
The tools that power this analysis
ICE Sustainable Finance links the geographic footprints of obligors — whether they are municipalities, corporates, or sovereigns — to securities. This geospatial framework allows us to identify obligors (and securities) that may be affected by hazard events and link those securities to the demographic, socioeconomic, and physical climate risk profiles of the obligated communities and assets. ICE Sustainable Finance already incorporates extreme weather maps for wildfires and hurricanes into monitoring of municipal bond securities obligated to affected communities. Going forward, global maps will be incorporated into monitoring of other securities, providing market stakeholders with information about the exposure of their entire portfolios to observed and forecasted hazards.
1 Bourdeau,-Brien, M & L Kryzanowski (2019). Municipal financing costs following disasters. Global Finance Journal 40, 48-64. Link
2 Zivin, J, Liao, J, & Y Pannassie. How hurricanes sweep up housing markets: Evidence from Florida. Journal of Environmental Economics and Management 118 (102770). Link
3 Klomp, J. (2015). Sovereign risk and natural disasters in emerging markets. Emerging Markets Finance and Trade, 51(6):1326–1341.
4 Klomp, J. (2017). Flooded with debt. Journal of International Money and Finance, 73:93–103.
5 NWS Burlington VT (15 Nov 2023). The Great Vermonth Flood of July 2023. Link
6 Cappucci, M, Samenow, J & B Dennis (18 Dec 2023). Record-setting storm wallops East Coast with flooding, high winds. The Washinton Post. Link
7 ICE Sustainable estimates population exposure numbers at 2 a.m. and 2 p.m., to reflect the exposure of people in their homes or workplaces depending on the time of day.
Limitations
This document contains information that is proprietary property of Intercontinental Exchange, Inc. and its affiliates (“ICE Group”) and is not to be published, reproduced, copied, disclosed or used without the express written consent of ICE Group.
This document is provided for informational purposes only. Nothing herein should in any way be deemed to alter the legal rights and obligations contained in agreements between ICE Group and its clients relating to any of the products or services described herein. Nothing herein is intended to constitute legal, tax, accounting or other professional advice.
The information contained herein is provided “as is.” ICE makes no warranties whatsoever, either express or implied, as to merchantability, fitness for a particular purpose, or any other matter. Without limiting the foregoing, ICE Group makes no representation or warranty that any data or information (including but not limited to evaluations) supplied to or by it are complete or free from errors, omissions, or defects.
All values included in the products and services described herein are estimates, including those values that are derived using data provided by other data providers as well as forecasts of expectations of change. Such estimates are based upon information available to ICE Group at the time of calculation, are provided as is, and should be treated as estimates and forecasts with potentially substantial deviations from actual outcomes, regardless of whether such features are explicitly described in any data dictionary, methodology, or definition as estimates or forecasts.
ICE Group is not registered as a nationally registered statistical rating organizations, nor should this document be construed to constitute an assessment of the creditworthiness of any company or financial instrument. Analytics available from ICE Group should not be considered an analyst’s opinion of the underlying investability of a particular location or security. No part of this service should be construed as providing investment advice.
Trademarks of Intercontinental Exchange, Inc. and/or its affiliates include: Intercontinental Exchange, ICE, ICE block design, NYSE, ICE Data Services, ICE Data and New York Stock Exchange. Information regarding additional trademarks and intellectual property rights of Intercontinental Exchange, Inc. and/or its affiliates is located at www.intercontinentalexchange.com/terms-of-use. Other products, services, or company names mentioned herein are the property of, and may be the service mark or trademark of, their respective owners.
© 2024 Intercontinental Exchange, Inc.