
Managing U.S. dollar risk in uncertain times
The U.S. Dollar Index ® (USDX) extended its downward trajectory in March after reaching a monthly high of 107.36 to close at 103.87 with a loss of 3.24%, the worst monthly performance since November 2022. The decline reflected a broader cooling in demand for the U.S. Dollar, driven by growing market unease over the potential economic fallout from proposed tariffs and their effects on domestic and global economic activity, which could potentially stoke inflationary pressures.
- Nonfarm Payrolls (NFP) for February fell short of market expectations with an increase of 151,000 new jobs compared to the anticipated 160,000 and up from January’s downwardly revised total of 125,000 (initially reported as 143,000). The unemployment rate edged higher to 4.1% in February, rising from 4.0% in January, while annual wage inflation rose to 4.0%, a slight decrease from the 4.1% reported the prior month. The USDX closed at 103.86, with a 0.29% loss on the day.
- Annual Core Inflation, excluding food and energy, surprised the markets after easing to a rate of 3.1% for the 12 months ending February, below market expectations of 3.2% and 3.3% reported for January. Additionally, the Consumer Price Index (CPI) for the same 12-month period also decreased from 3.0% to 2.8%. These inflation reports led to the USDX closing the day with a gain of 0.13% at 103.55.
- The Federal Open Market Committee (FOMC) held the federal funds rate steady at 4.25% - 4.50% during its March meeting, in line with market expectations. This move signaled the Fed’s cautious stance as it continued to assess a mixed economic picture, balancing stubborn inflation pressures with a steady labor market. Policymakers appeared to be taking a measured wait-and-see approach. The USDX closed with a gain of 0.16% at 103.10.
Insights provided by

Macro Commentary
U.S. Dollar Index® Focus
SYMBOL: DX
High impact events per day
| 10 | Consumer Price Index |
| 11 | Producer Price Index & Michigan Consumer Sentiment Index PREL |
| 16 | Retail Sales |
| 23 | S&P Global Manufacturing PMI (PREL) and S&P Global Services PMI (PREL) |
| 29 | Gross Domestic Product (GDP) Annualized Q1 PREL & Core Personal Consumption Expenditures - Price Index |
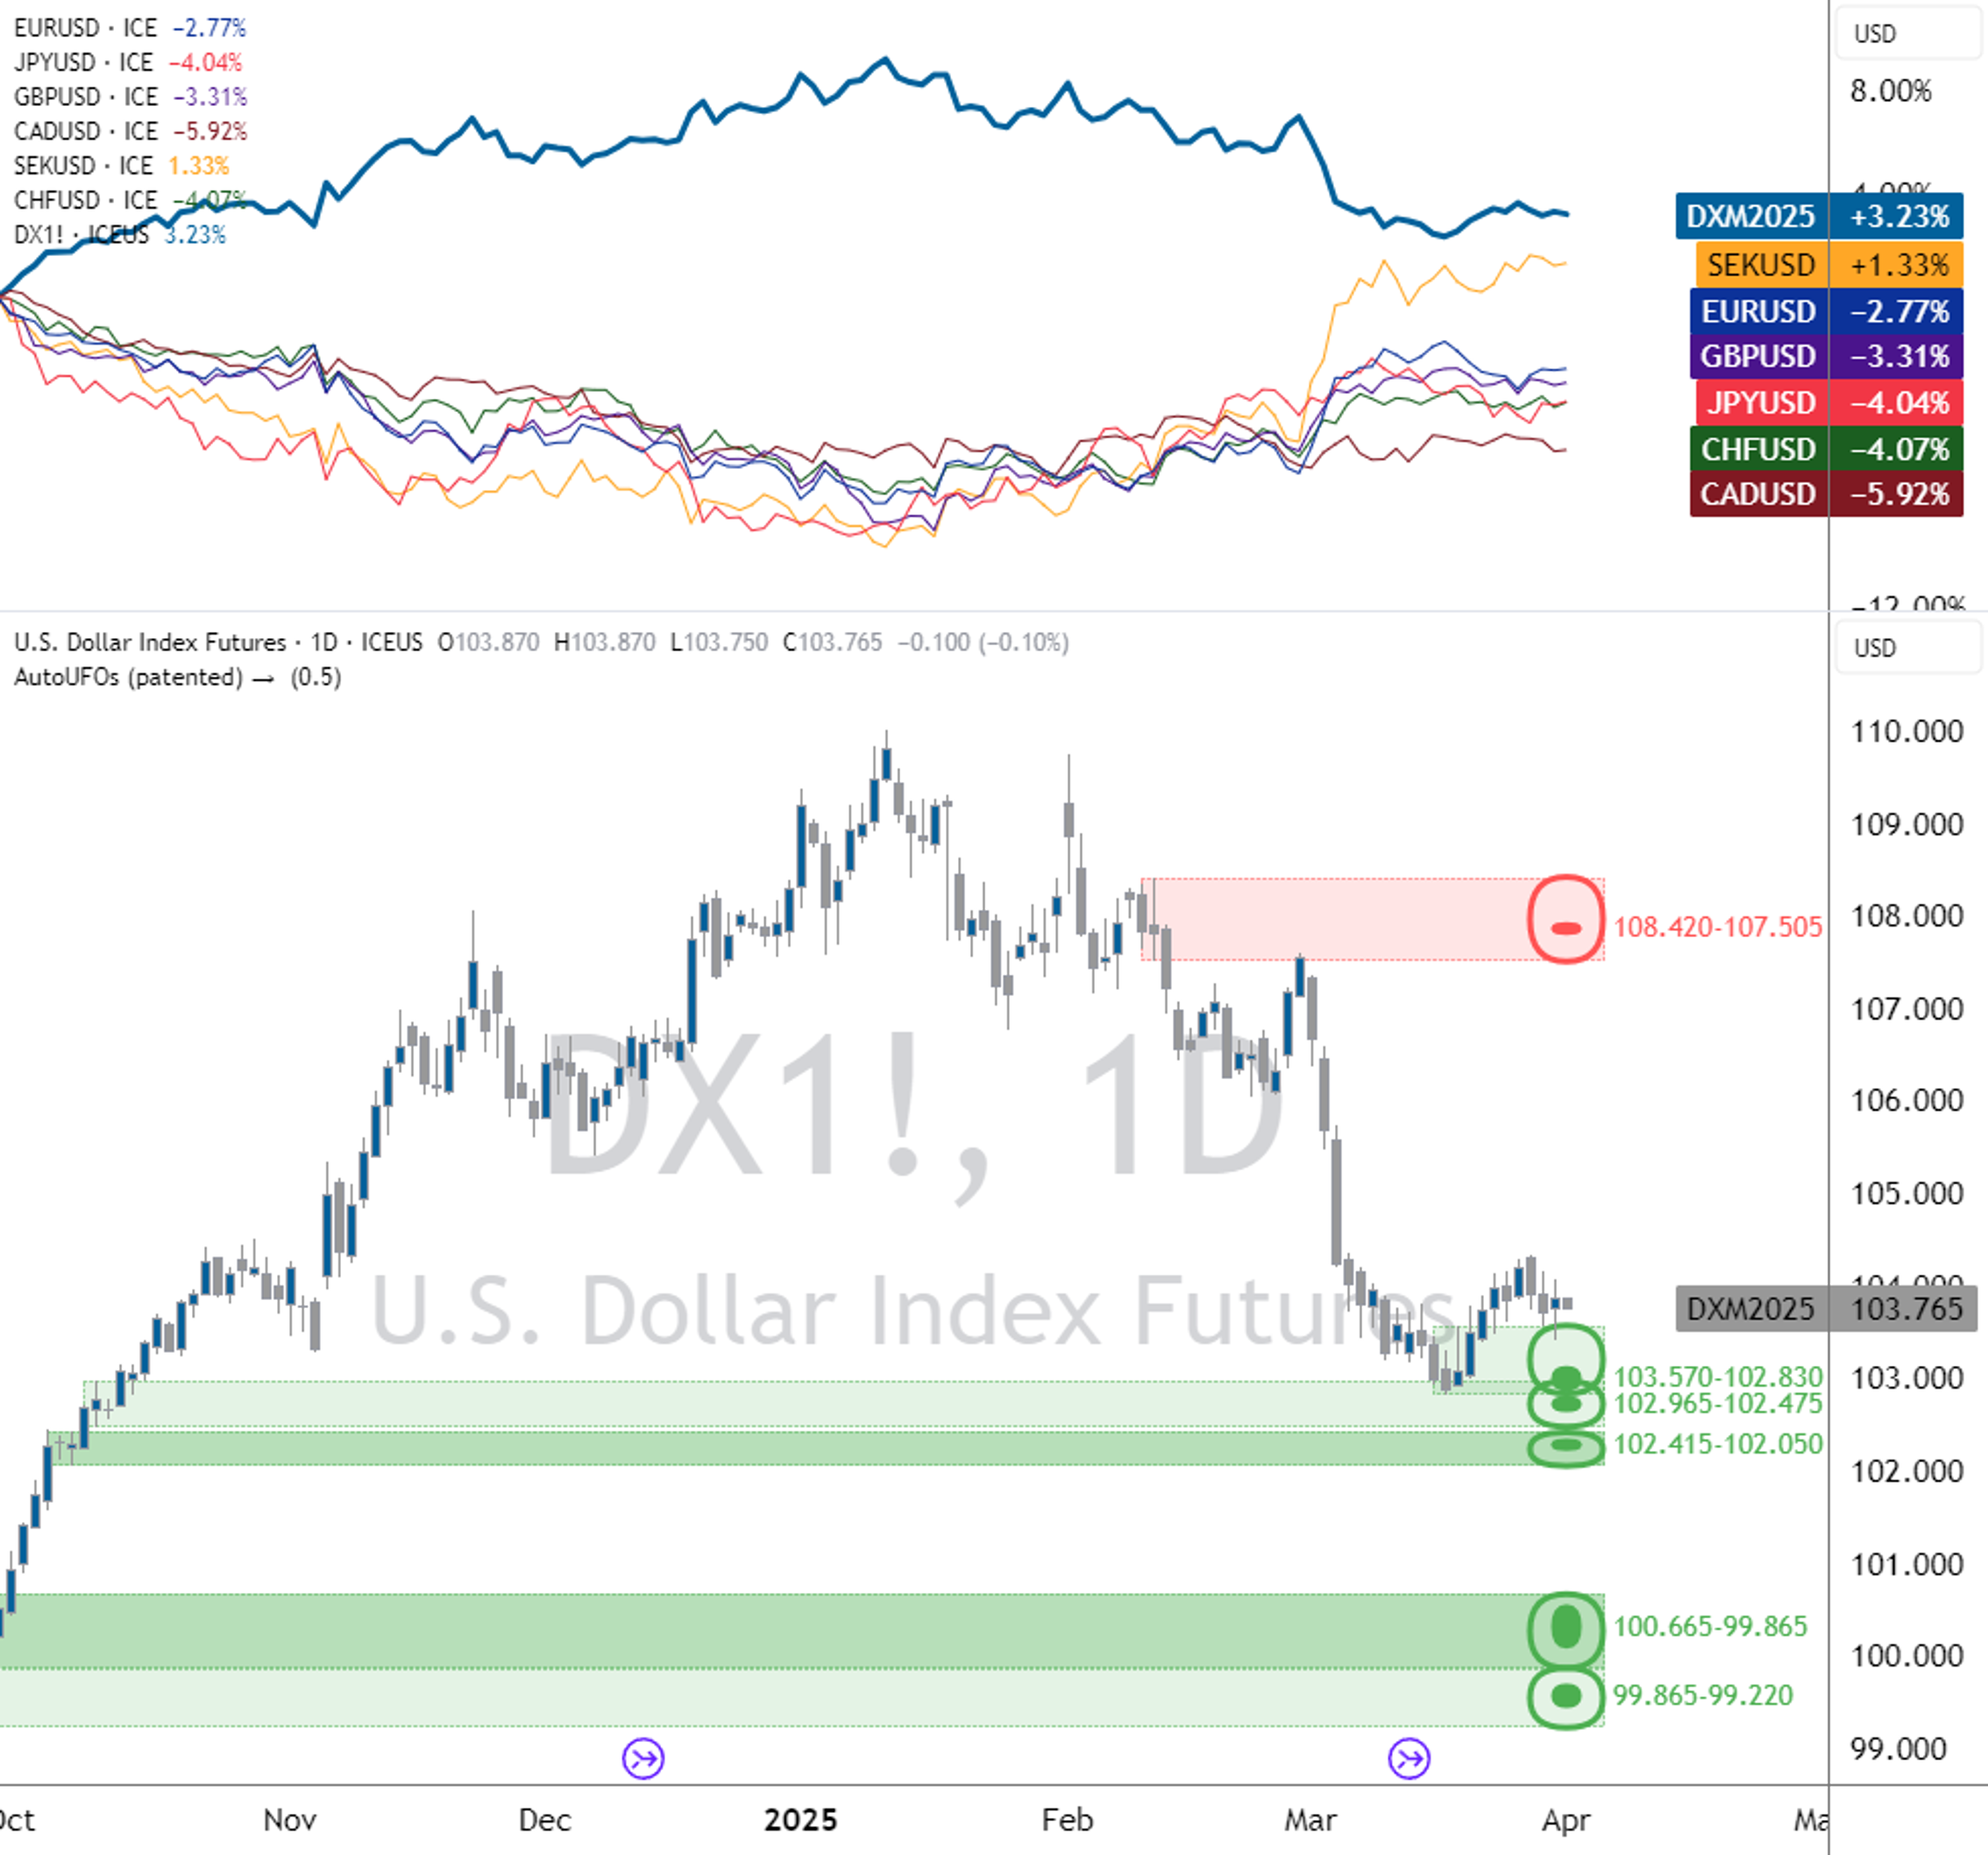
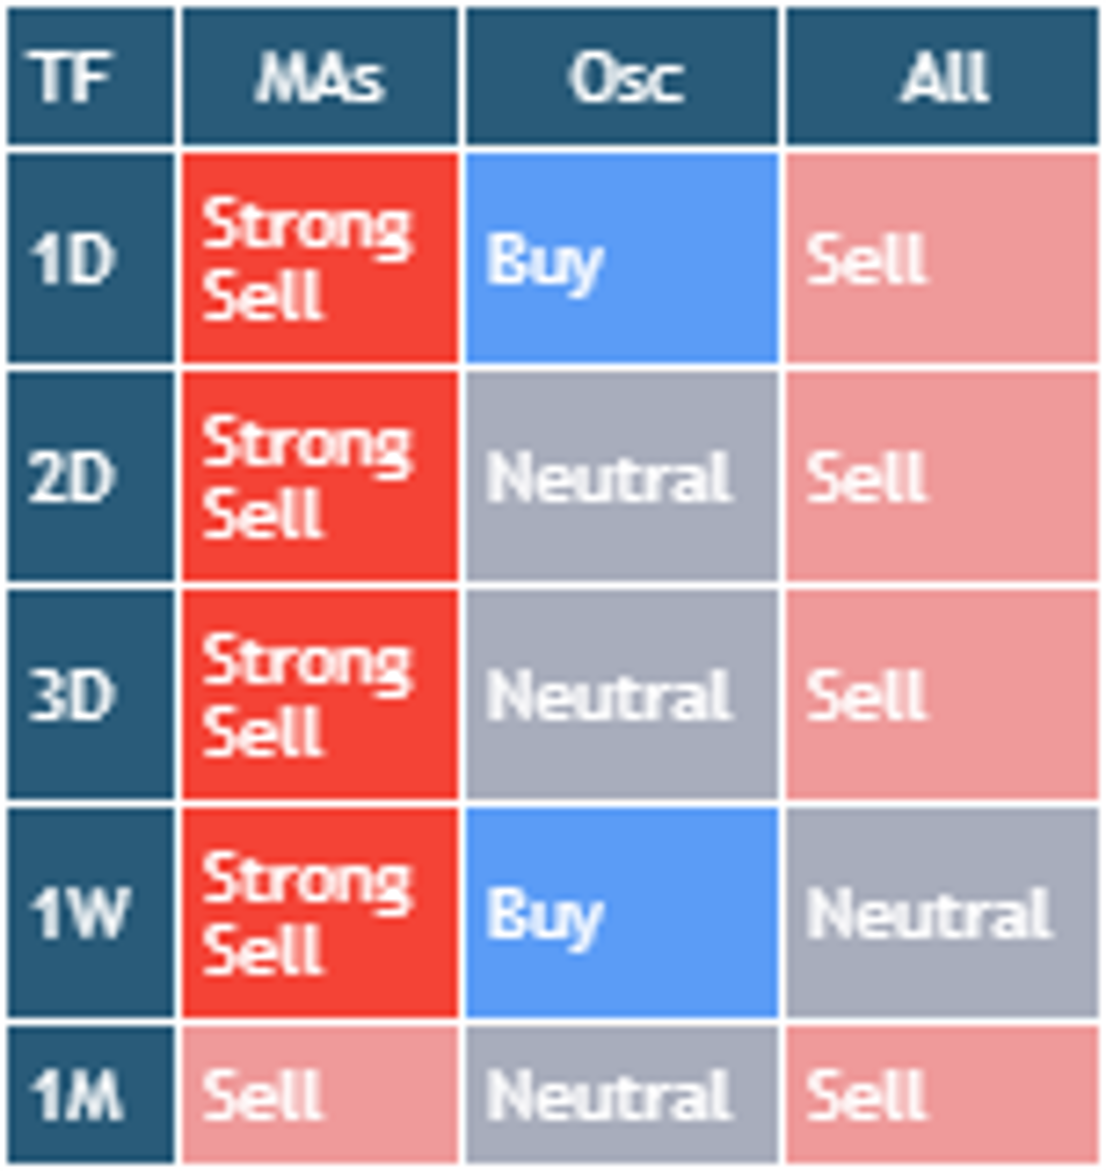
Weighting: EUR 57.6% / JPY 13.6% / GBP 11.9% / CAD 9.1% / SEK 4.2% & CHF 3.6% | Source: TradingView | Conditions Table: using daily SMA (10, 20, 30,50, 100, 200), EMA (10, 20, 30,50, 100, 200), Ichimoku Cloud (9, 26, 52), VWMA (20), HullMA (9), RSI (14), Stochastic (14, 3, 3), CCI (20), ADX (14, 14), Awesome Oscillator, Momentum (10), MACD (12, 26, 9), Stochastic RSI (3, 3, 14, 14), Williams %R (14), Bulls and Bears Power and Ultimate Oscillator (7,14,28) | Support & Resistance Levels: using AutoUFOs® (0.5) applied to a daily timeframe (plotted as dotted lines that represent relevant support and resistance price zones colored as follows: red = resistance levels & green = support levels)
Trading began on March 3rd, with the USDX initially reaching a high of 107.36, piercing the midpoint of the daily Bollinger Bands and just falling short of a daily resistance area at 107.50 - 108.42 that was tested on the last day of February, before demand for the U.S. Dollar weakened. The ISM Manufacturing PMI data came in at 50.3, slightly below the expected 50.5 and down from January’s 50.9. While still in expansion territory, for the second consecutive month, the data indicated stagnating factory activity, contributing to the U.S. Dollar Index ® closing down 0.81% at 106.48. The bearish sentiment persisted the following day as the USDX closed lower, down 0.90%, to rest at the lower boundary of the daily Bollinger Bands. On March 5th, the ADP Employment Change report revealed a sharp slowdown in private-sector job creation, with just 77,000 new positions added, significantly below the expected 140,000 and substantially weaker than the upwardly revised 186,000 jobs reported in January. Market concerns were further heightened by a speech from President Trump regarding the new potential tariff measures and geopolitical posturing, which introduced an element of policy uncertainty. Although the ISM Services PMI data came in above expectations at 53.5, indicating resilience in the services sector, the earlier employment data and Trump's speech had already eroded market confidence in the U.S. economic outlook. After a sharp decline, the U.S. Dollar Index ® closed with a loss of 1.24% at 104.27. The bearish sentiment continued throughout the following day as demand for the U.S. Dollar continued to weaken. On March 7th, the labor market data added further pressure after Nonfarm Payrolls increased by 151,000 in February, falling short of expectations of 160,000. Additionally, the previous month’s figure was revised downward to 125,000, reinforcing concerns about a slowdown in job growth. Average Hourly Earnings met expectations at 0.3% month-on-month, but the annual figure slipped to 4.0% from a prior 4.1%, pointing to easing wage inflation. The USDX closed down 0.29% at 103.85, marking a weekly loss of 3.25% and the worst weekly performance since November 2022.
The following week, the USDX began on a positive note as the bulls returned, and the U.S. Dollar Index ® closed with a gain of 0.10% at 103.90, settling on the lower boundary of the daily Bollinger Bands. March 11th, the sentiment reversed, and the market declined sharply as U.S. Dollar demand weakened, closing the day with a loss of 0.49% before finding support. On March 12th, Annual Core Inflation, excluding food and energy, surprised the markets after easing to a rate of 3.1% for the 12 months ending February, below market expectations of 3.2% and 3.3% reported for January. Additionally, the broader Consumer Price Index (CPI) for the same 12-month period decreased from 3.0% to 2.8%, reversing the recent upward trend. Although the data confirmed that inflation pressures were easing, markets showed a measured response. The USDX reached a high of 103.76 before pulling back to close at 103.55, with a gain of 0.13%. March 13th Producer Price Index (PPI) data (excluding food and energy) came in at 3.4% year-on-year, slightly below the expected 3.5%, indicating that price pressures were moderating across both consumer and producer levels. After the initial market reaction, the USDX closed at 103.76 with a gain of 0.15%. On Friday, the bullish sentiment deteriorated during the European session, and the demand for the U.S. Dollar dropped sharply. The bearish sentiment was compounded by the release of disappointing Consumer Sentiment Index data, which fell to 57.9, significantly below expectations of 63.1 and marking the lowest level since 2023. The U.S. Dollar Index ® closed at 103.36, down 0.14%, and ended the week with a loss of 0.41%.
The bearish momentum continued into the week of March 17th following the disappointing February Retail Sales figures. Headline retail sales rose just 0.2%, missing forecasts of 0.7%, while the previous month saw a sharp downward revision to -1.2 %. The U.S. Dollar weakened in response, with the USDX dropping 0.32% to close at 103.03 within a daily support area at 103.15 to 102.82. On March 18th, with no significant data to digest, markets remained cautious and the U.S. Dollar drifted lower with the USDX closing down 0.18% at 102.91, extending the week's decline. However, March 19th marked a turning point. The FOMC held interest rates steady at 4.25% - 4.50%, as expected, and updated economic projections. The USDX declined after the announcement, erasing some of the day's earlier gains; nonetheless, the USDX rose 0.16% on the day, to close at 103.10. On March 20th, the index bounced from the daily support area to close up 0.39%, the strongest daily gain of the week, and the month closing at 103.45. On March 21st, President Trump delivered another speech, and with no significant economic data released, the bulls drove the USDX higher, closing up 0.34% at 103.79, marking a 0.41% gain for the week.
Initially, during the week of March 24th, the demand for the U.S. Dollar persisted, and the USDX closed with a gain of 0.21% at 103.98. The move came despite the weaker-than-expected S&P Global Manufacturing PMI, which fell to 49.8 in the preliminary March reading, below the 50.0 contraction threshold and sharply down from February’s 52.7. However, the services sector painted a brighter picture, with the S&P Global Services PMI rising to 54.3, significantly above the forecast of 51.2. The stronger services print helped buoy market confidence and kept the U.S. Dollar supported. On March 25th, the demand for the U.S. Dollar weakened, and the USDX closed down 0.13% to 103.85. March 26th brought renewed strength to the U.S. Dollar, and the USDX rose 0.30% to close at 104.20, testing the midpoint of the daily Bollinger Bands. March 27th saw the release of the final Q4 2024 U.S. GDP figures, which showed the economy expanding at an annualized rate of 2.4%, slightly above the expected 2.3%. While this reinforced the narrative of a still-resilient U.S. economy, the U.S. Dollar response was more muted, and demand weakened. The USDX ended down 0.38% at 103.92. March 28th, the Core PCE Price Index was released, coming in above expectations. The Core Personal Consumption Expenditures Price Index rose 0.4% month-on-month against 0.3% forecast and 2.8% year-on-year against 2.7% forecast and the prior release, suggesting that inflationary pressures remained sticky. The USDX dipped 0.21%, closing the week at 103.70. The month's final trading day ended positively, with the index closing at 103.87, with a 0.11% gain. Despite a slight increase in demand for the U.S. Dollar in the latter half of the month, the U.S. Dollar Index closed the month, posting the largest monthly loss since November 2022, down 3.24%.
The U.S. Dollar Index ® reverted to a downtrend during March on the weekly timeframe, trading below the weekly SMA and EMA 20, 30, and 50. The U.S. Dollar Index ® maintained its downtrend on the daily after trading below the 20, 30, and 50 EMAs and SMAs.
Source: ICE Connect
USDX® Performance
| Spot Rates | TICKER | 3-Mar-25 | 31-Mar-25 | Monthly Change* |
|---|---|---|---|---|
| USD/EUR | EUR A0-FX | 1.04839 | 1.08185 | 3.093% |
| JPY/USD | JPY A0-FX | 149.472 | 149.888 | -0.278% |
| USD/GBP | GBP A0-FX | 1.2699 | 1.2915 | 1.672% |
| CAD/USD | CAD A0-FX | 1.44779 | 1.43826 | 0.663% |
| SEK/USD | SEK A0-FX | 10.49111 | 10.03279 | 4.568% |
| CHF/USD | CHF A0-FX | 0.89607 | 0.88382 | 1.386% |
| US Dollar Index | DX A0 | 106.747 | 104.21 | -2.435% |
| Front Month | Ticker | 3-Mar-25 | 31-Mar-25 | Monthly Change |
|---|---|---|---|---|
| Mini USDX | SDX-ICS | 106.669 | 103.883 | -2.682% |
OTHER CONTRACTS | TICKER | 3-Mar-25 | 31-Mar-25 | Monthly Change |
|---|---|---|---|---|
| Brent Crude | BM-ICS | 71.62 | 74.77 | 4.213% |
| MSCI World Index | MWL | 3774.4 | 3646.6 | -3.505% |
| MSCI Emerging Markets Index | MME | 1086.6 | 1110.8 | 2.179% |
Mini US Dollar/Offshore Renminbi | CHM-ICS | 7.2974 | 7.2551 | 0.583% |
Source: ICE Connect
Restrictions on Distribution
The distribution of this document and the offering of any products, investments or strategies mentioned in it may be restricted by law in certain jurisdictions. None of ICE Futures Singapore, Intercontinental Exchange Inc. nor any of their affiliates (collectively, “ICE”) represent that this document may be lawfully distributed, or that any product, investment, or strategy described in it may be lawfully offered in compliance with any applicable laws or requirements in any such jurisdiction.
Disclosure Section
This document does not provide individually tailored financial or investment advice, and no part of this document should be construed as doing so. This document has been prepared without regard to the individual financial or other circumstances and objectives of persons who receive it. Investors and users should independently evaluate particular products, investments, and strategies and are encouraged to seek the advice of a financial advisor. The appropriateness of a particular product, investment or strategy will depend on a user or investor's individual circumstances and objectives. The products, investments or strategies discussed in this document may not be suitable for all users and investors, and certain users or investors may not be eligible to purchase or participate in some or all of them.
ICE Futures Singapore does not provide financial, investment, legal or tax advice and is not in the business of doing so. Each user or investor should always consult a financial, investment, legal or tax advisor for information concerning its individual situation and to learn about any potential financial, investment, legal, tax or other implications that may result from any product, investment or strategy described in this document.
In particular, any opinion contained in this document (including an indication of any “sell”, “neutral” or “buy” condition) is generic and not a recommendation to take (or omit to take) any action in relation to any product, investment or strategy.
Key Information Documents for certain products covered by the EU Packaged Retail and Insurance-based Investment Products Regulation can be accessed on the relevant exchange website under the heading “Key information Documents (KIDS)”.
© 2024 Intercontinental Exchange, Inc. The information and materials contained in this document - including text, graphics, links or other items - are provided for general information only on an "as is" and "as available" basis. Although this document is issued in good faith, no representation, warranty or guarantee, whether express or implied, is or will be made in respect of the information contained herein. ICE excludes all liability arising from or in relation to the accuracy, adequacy, completeness, fitness or timeliness of the information provided and assumes no duty whatsoever. The information in this document is liable to change, and ICE undertakes no duty to update such information. You should not rely on any information contained in this document without first checking that it is correct and up to date. No information set out or referred to in this document shall form the basis of any contract. The content of this document is proprietary to ICE in every respect and is protected by copyright. No part of this material may be copied, photocopied or duplicated in any form by any means or redistributed without the prior written consent of ICE. All third-party trademarks are owned by their respective owners and are used with permission.
Trademarks of ICE and/or its affiliates include Intercontinental Exchange, ICE, ICE block design, NYSE, and New York Stock Exchange. Information regarding additional trademarks and intellectual property rights of Intercontinental Exchange, Inc. and/or its affiliates is located at www.intercontinentalexchange.com/terms-of-use