Measures of market liquidity
Liquidity refers to the degree of ease with which an asset such as a futures contract can be bought or sold in a timely manner, and the costs associated with that transaction. Liquidity tends to manifest itself in the form of high trading volumes -- making it easy for market participants to get in or out of positions -- and with the lowest cost of trading. As such, market liquidity can be a critical consideration for commercial participants so they can readily find willing buyers and sellers for their hedging while executing their trades with minimal cost. Increased participation in a market in the form of number and diversity of firms -- including financial firms and market makers -- creates greater opportunities to express price opinions and transact, thereby boosting liquidity that benefits all market players.
Two commonly used metrics to describe market activity and liquidity in the context of futures trading are the average daily volume (ADV) and open interest. Open interest refers to the number of open contracts in a market (with each contract representing a long and short position) and therefore indicates the commitment firms have expressed in that market. Increased levels of participation from a diversity of firms improves liquidity with corresponding increases in ADV and open interest. This is seen in the example provided in Exhibit 5 for the Dutch TTF natural gas futures market at ICE. The Dutch TTF Natural Gas futures market has seen a significant surge in both daily volumes and open interest as trading firm participation grew more than fourfold from 2014 to the present day. As a consequence the price on the TTF market is seen as a true reflection of the price of European gas and can be used as a comparison to then judge the price of gas supplied in other areas of Europe.
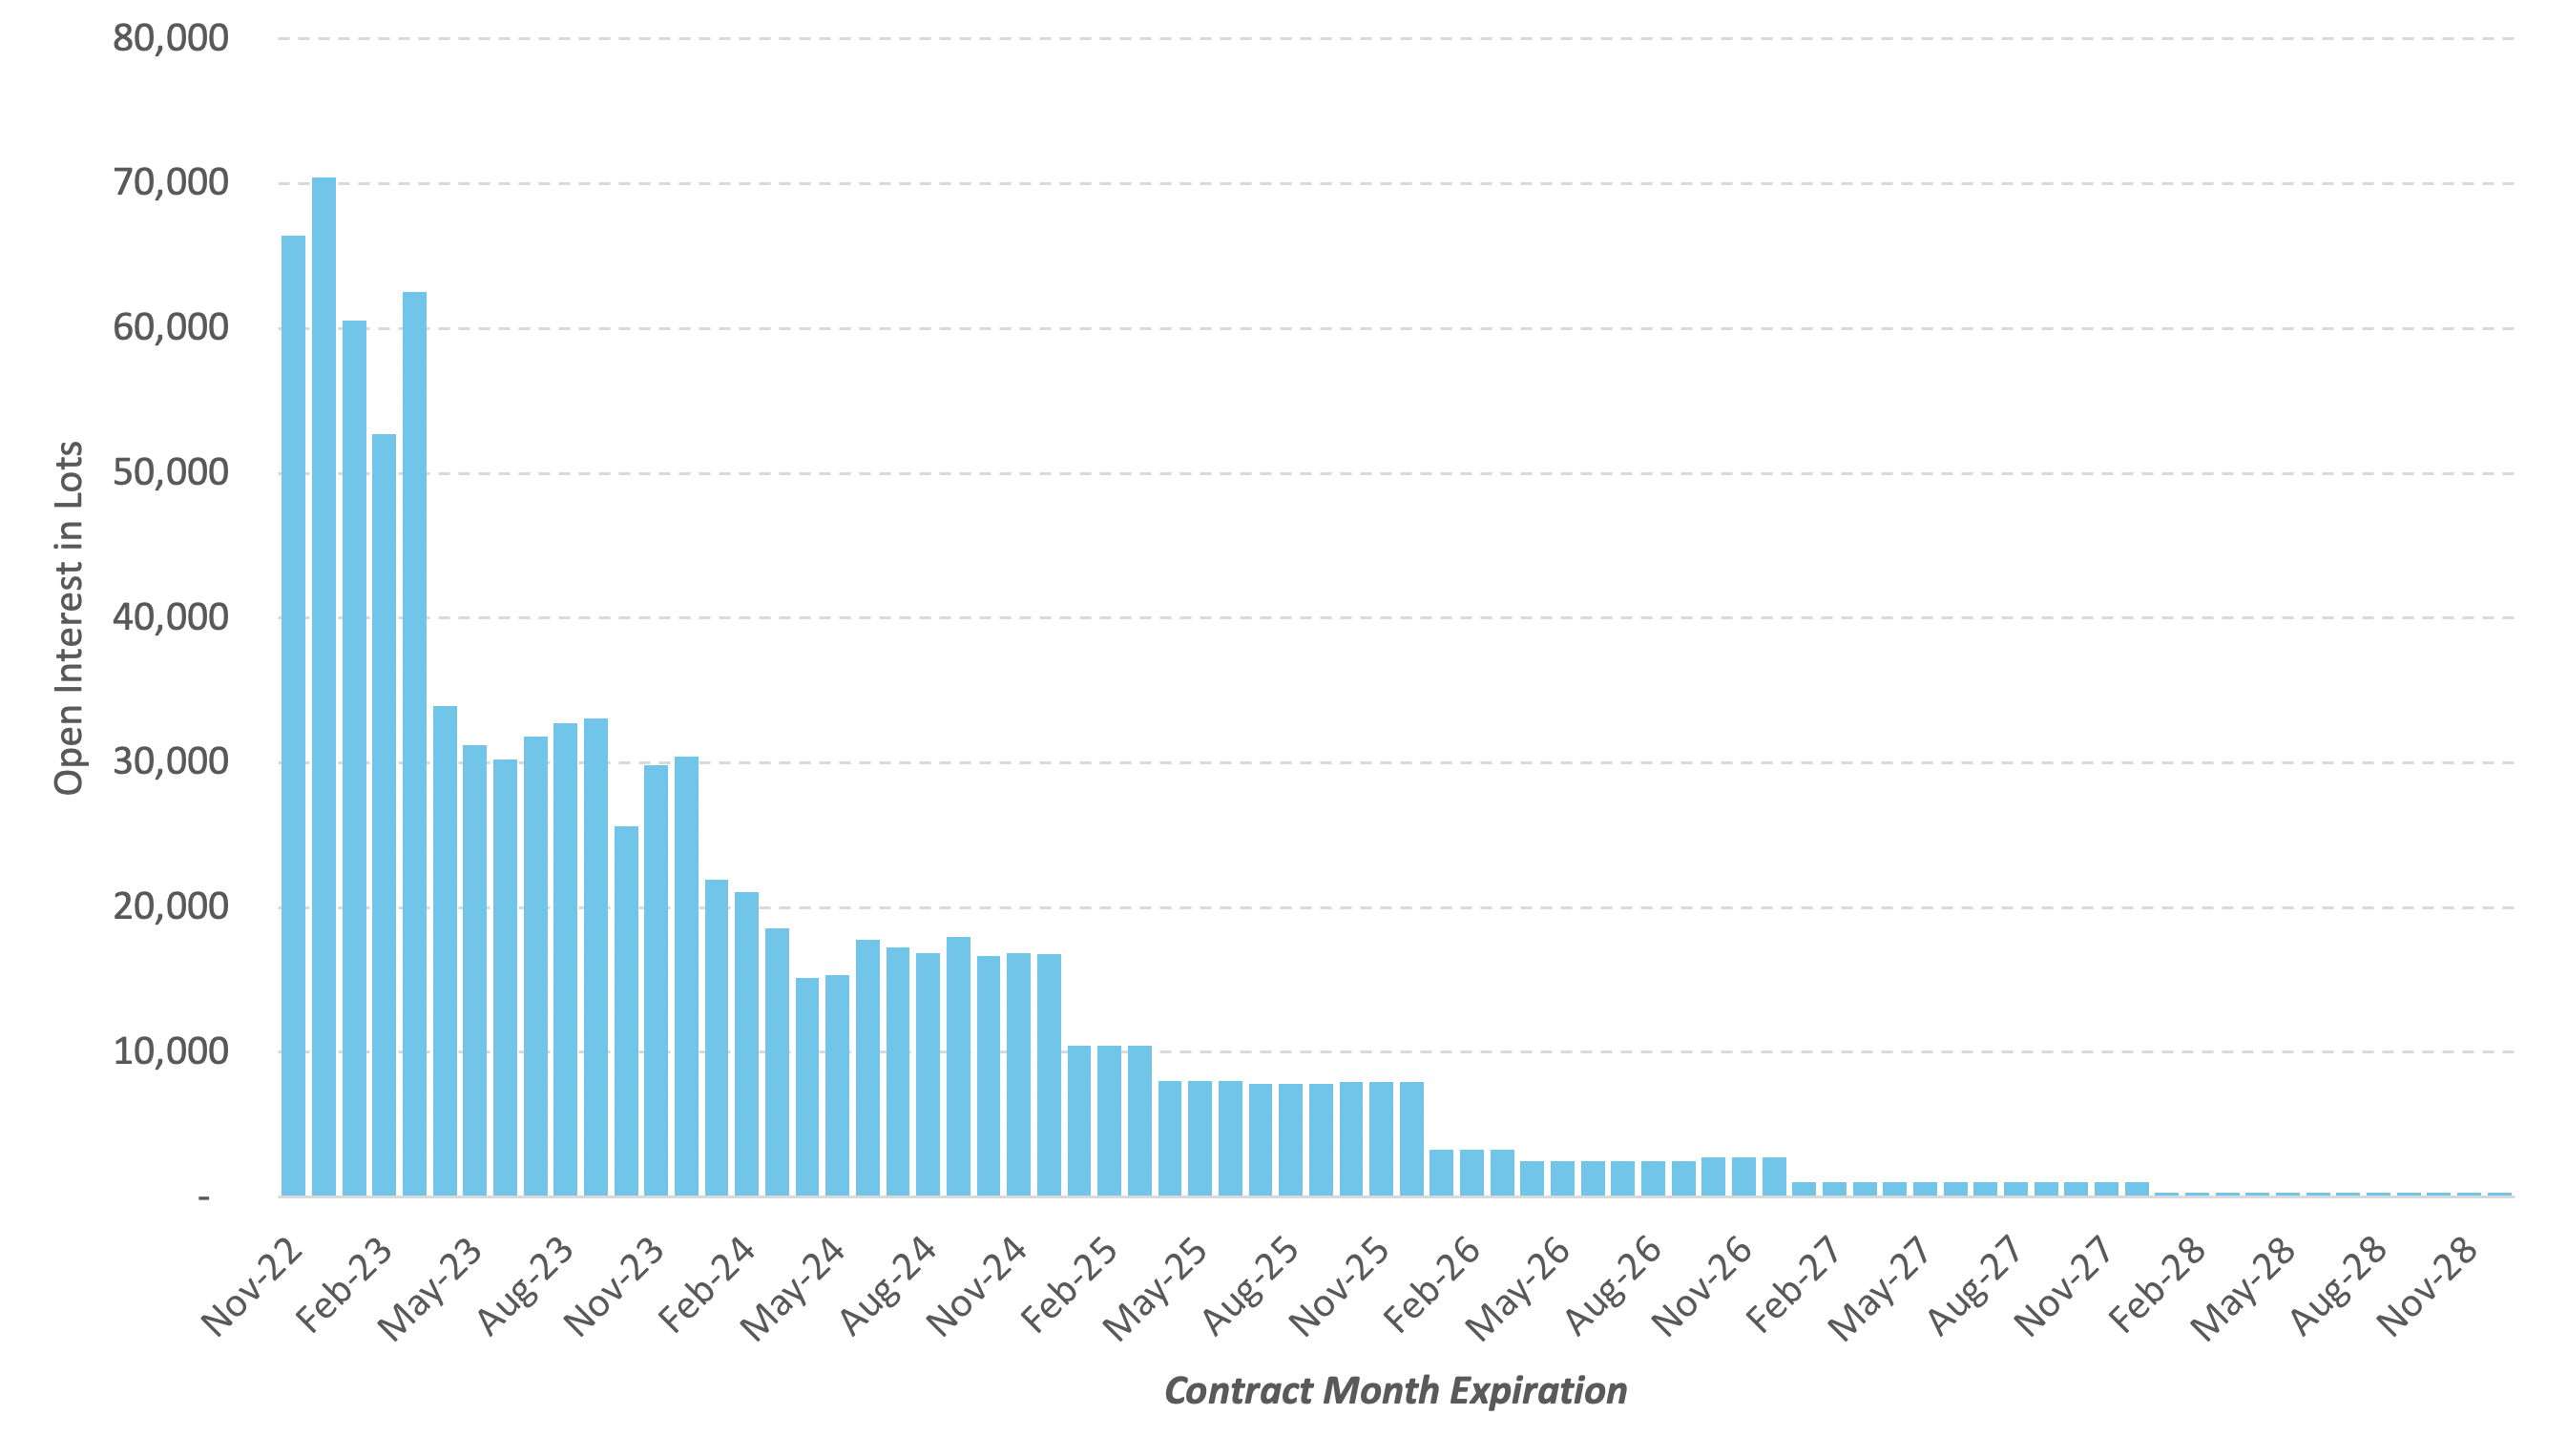
Beyond the daily volume and open interest metrics, an important indicator for well-functioning futures markets is the breadth of contracts available along the pricing curve. The further out liquid contracts are available, the more informed the price discovery process -- in other words, the longer the maturity on the longest-dated contract, and the more liquidity these contracts attract, the greater the risk management opportunities and information available to market participants. Again, financial players and market makers play a key role as enablers of liquidity further out on the futures curve that creates benefits for all players in a market. As an example, open interest in the Dutch TTF natural gas futures market at ICE is up to and including December 2028 as seen in Exhibit 6.
Exhibit 5: Monthly Average Daily Volume, Open Interest and Participation trend in Dutch TTF Gas Futures since Jan-2014 (Jan’14 values = 100)
Source: ICE Data
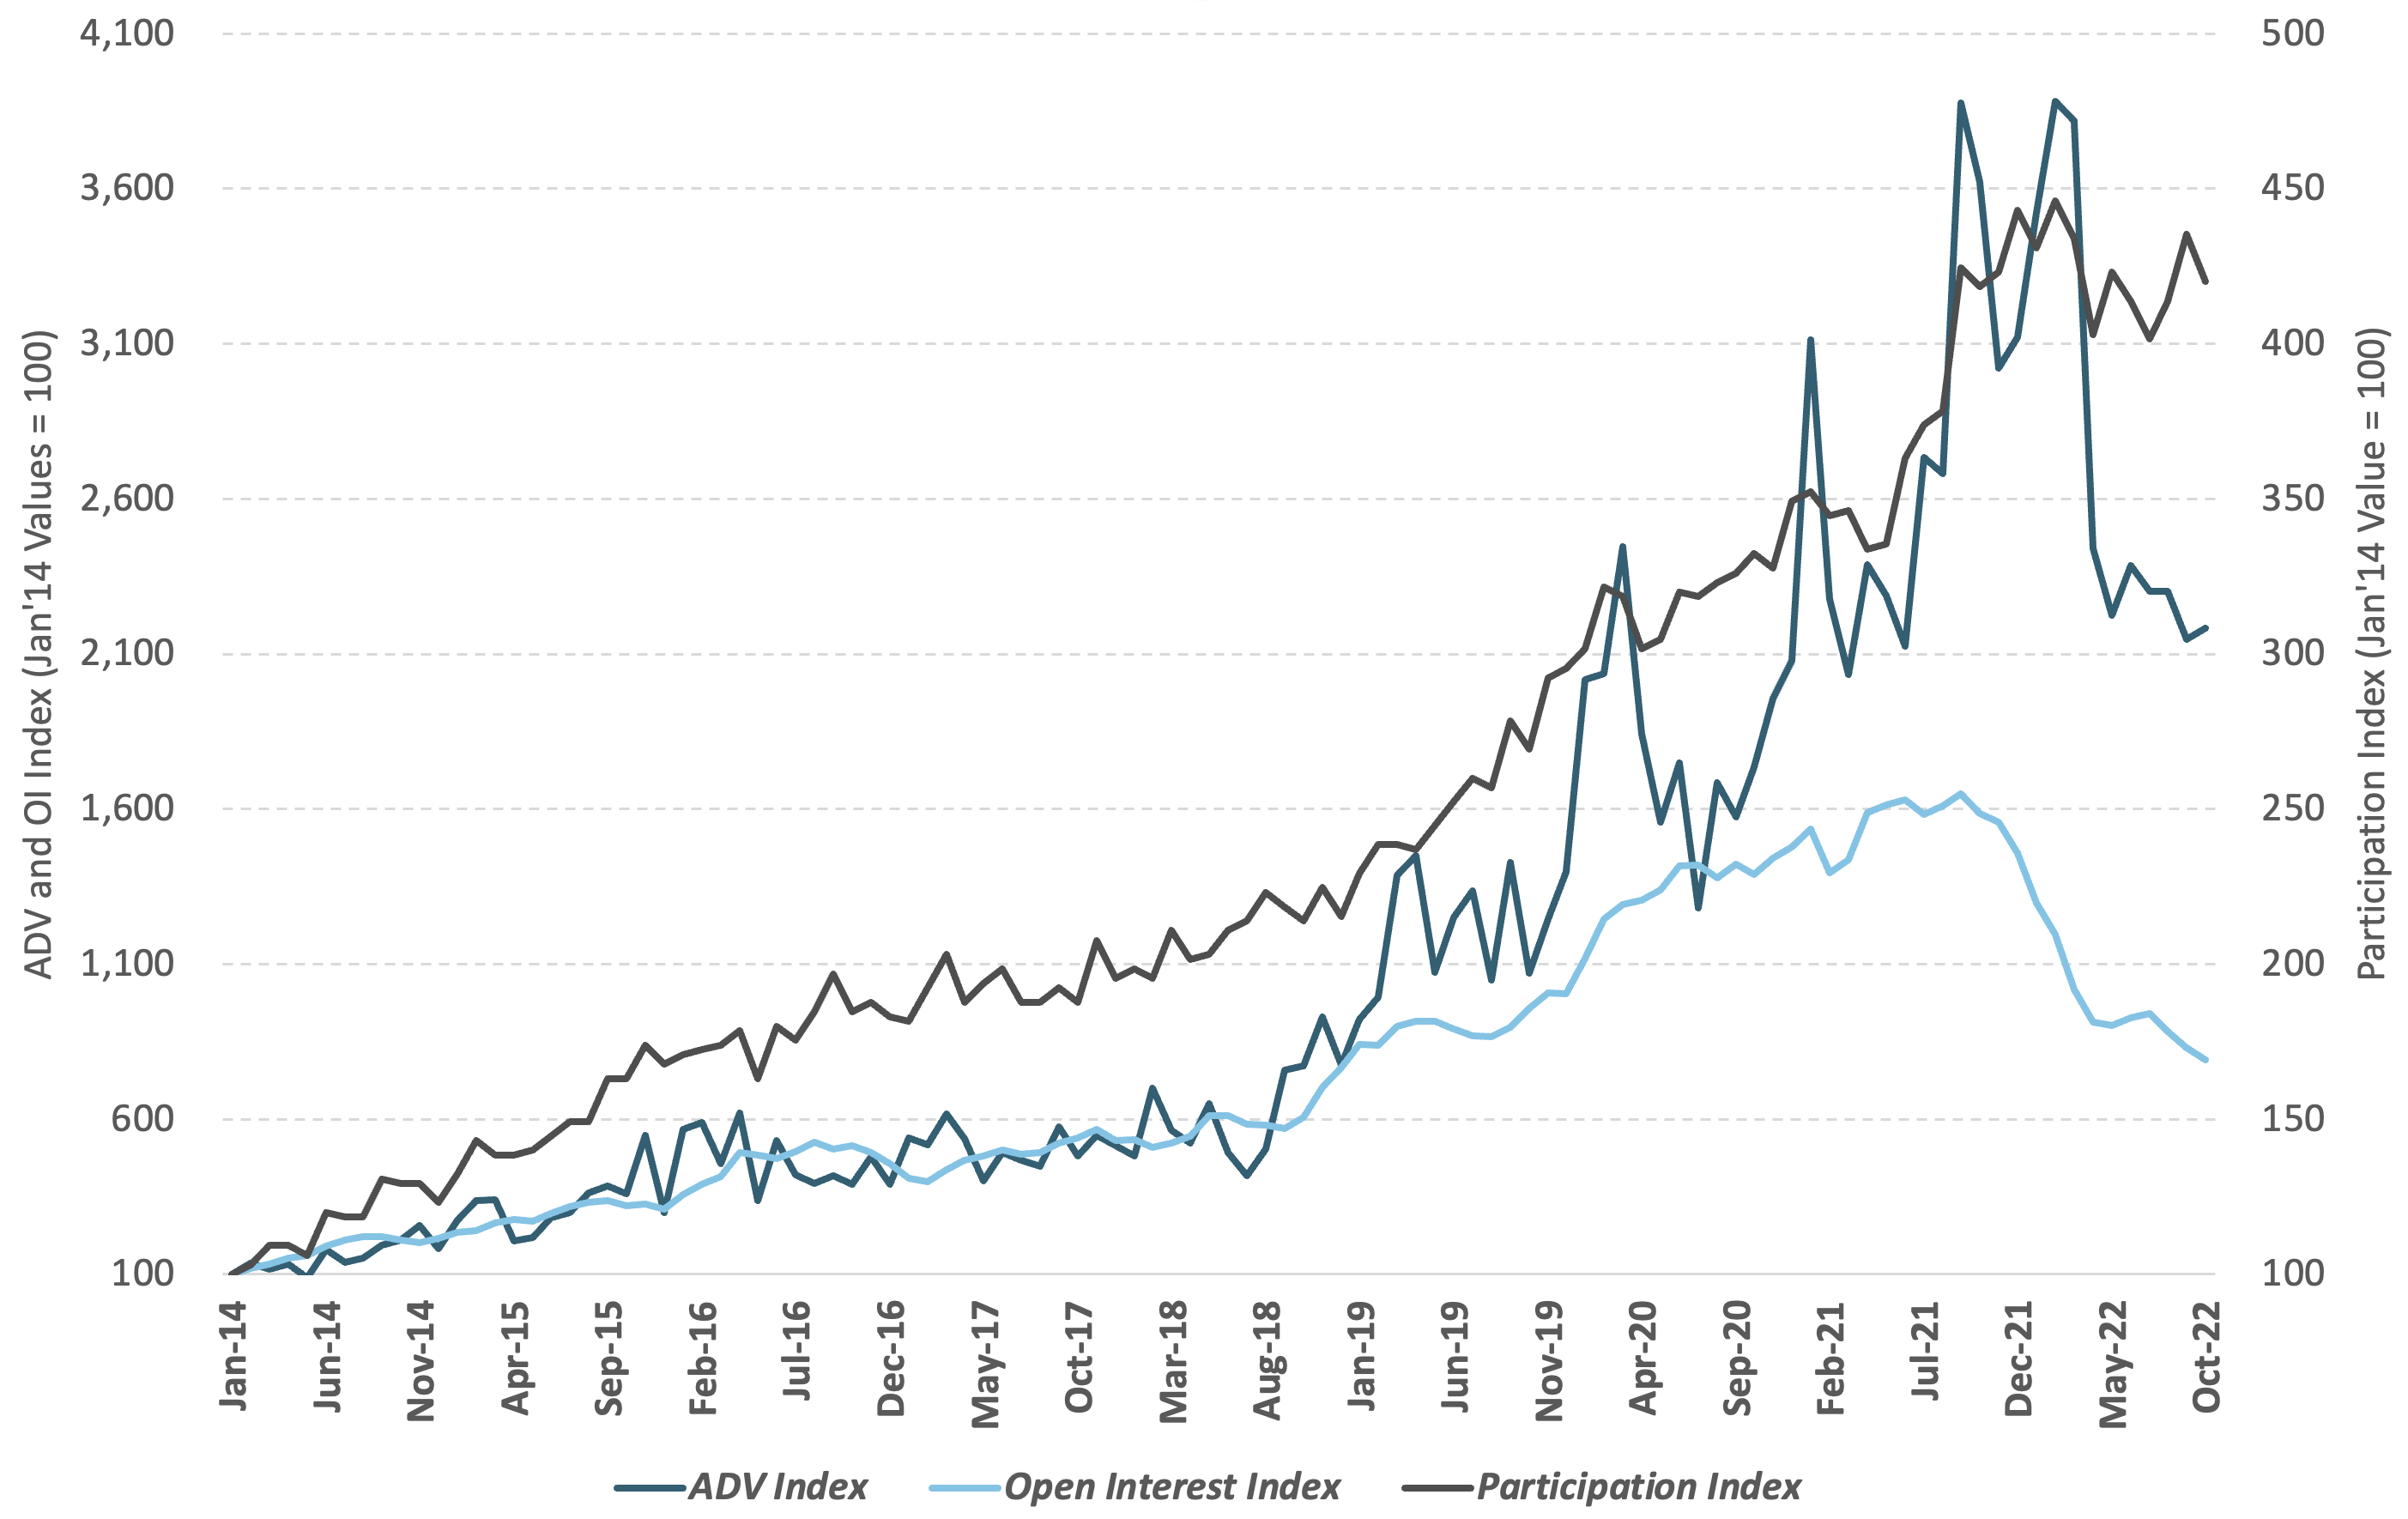
Exhibit 6: Open Interest profile by contract maturity for Dutch TTF Gas Futures as of 10 October 2022
Source: ICE Data
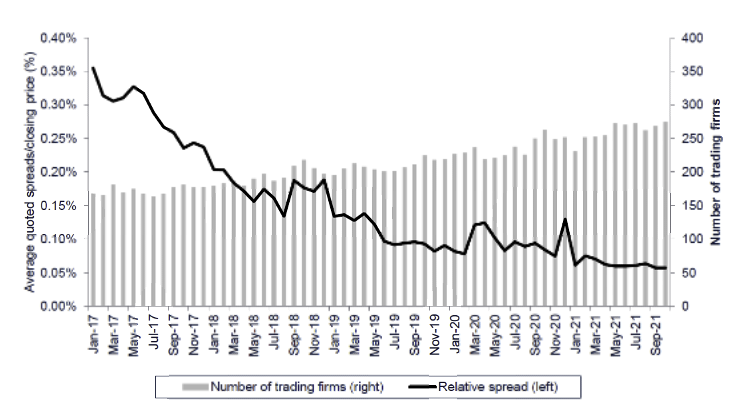
Another common metric used to assess liquidity in conjunction with traded volumes and open interest is the bid-ask spread. This measures the difference between prevailing best buy and best sell prices in the centralized order book and is indicative of the cost to trade in a market. In general, the more participants that enter the market wishing to buy or sell at or near the current price, the greater the competition for liquidity provision and the narrower the bid-ask spread. In markets with barriers to entry for trading participants, bid-ask spreads can be wider due to limited competition between liquidity providers.
Analysis of the EUA futures market at ICE (Exhibit 7) shows that as the number of trading participants trading EUA futures grew since 2017, relative bid-ask spreads (calculated as the average quoted spread divided by the closing price) in the benchmark EUA contract fell significantly, meaning that the transaction costs for trading EUAs have declined for all market participants since 2017.
Exhibit 7: Average daily relative bid-ask spread for the nearby December EUA futures contract
Source: Oxera analysis based on ICE data