
U.S. Census tract boundaries: how to solve an ever-changing challenge
Census tract geometries are adjusted every year by the U.S. Census Bureau, often complicating year-over-year comparisons of the demographic, socioeconomic, or employment characteristics of individual communities. Using our geospatial downscaling and re-aggregation approach, ICE solves this problem—making these comparisons trivially easy.
Published
September 2024
Census tracts are a fundamental building block of the data provided by the U.S. Census. Each one is defined as a specific geospatial boundary with a unique 10-digit “geo-identifier.” Every year the U.S. Census makes small changes to tract geometries, with a major overhaul every ten years to maintain around 4,000 people per tract. In some cases, underlying tract geometries change; in others, new tracts are created or removed entirely. Between 2017 to 2020, there was an increase of over 10,000 tracts defined by the U.S. Census Bureau. Small changes from year to year can make it difficult to directly compare census data across years for individual communities, and the larger changes every decade make long-term analyses even harder.
Williamson County in Texas, just a few miles north of Austin, provides a good example. Between 2017 and 2020, the county population grew by about 50,000, making it one of the fastest growing areas of the country. Because of the population influx, the number of census tracts in the county increased from 89 in 2017 to 135 in 2020 (Figure 1). For many of these tracts, data from 2017 and 2020 cannot be easily compared because of the extent of the tract geography and definition changes.
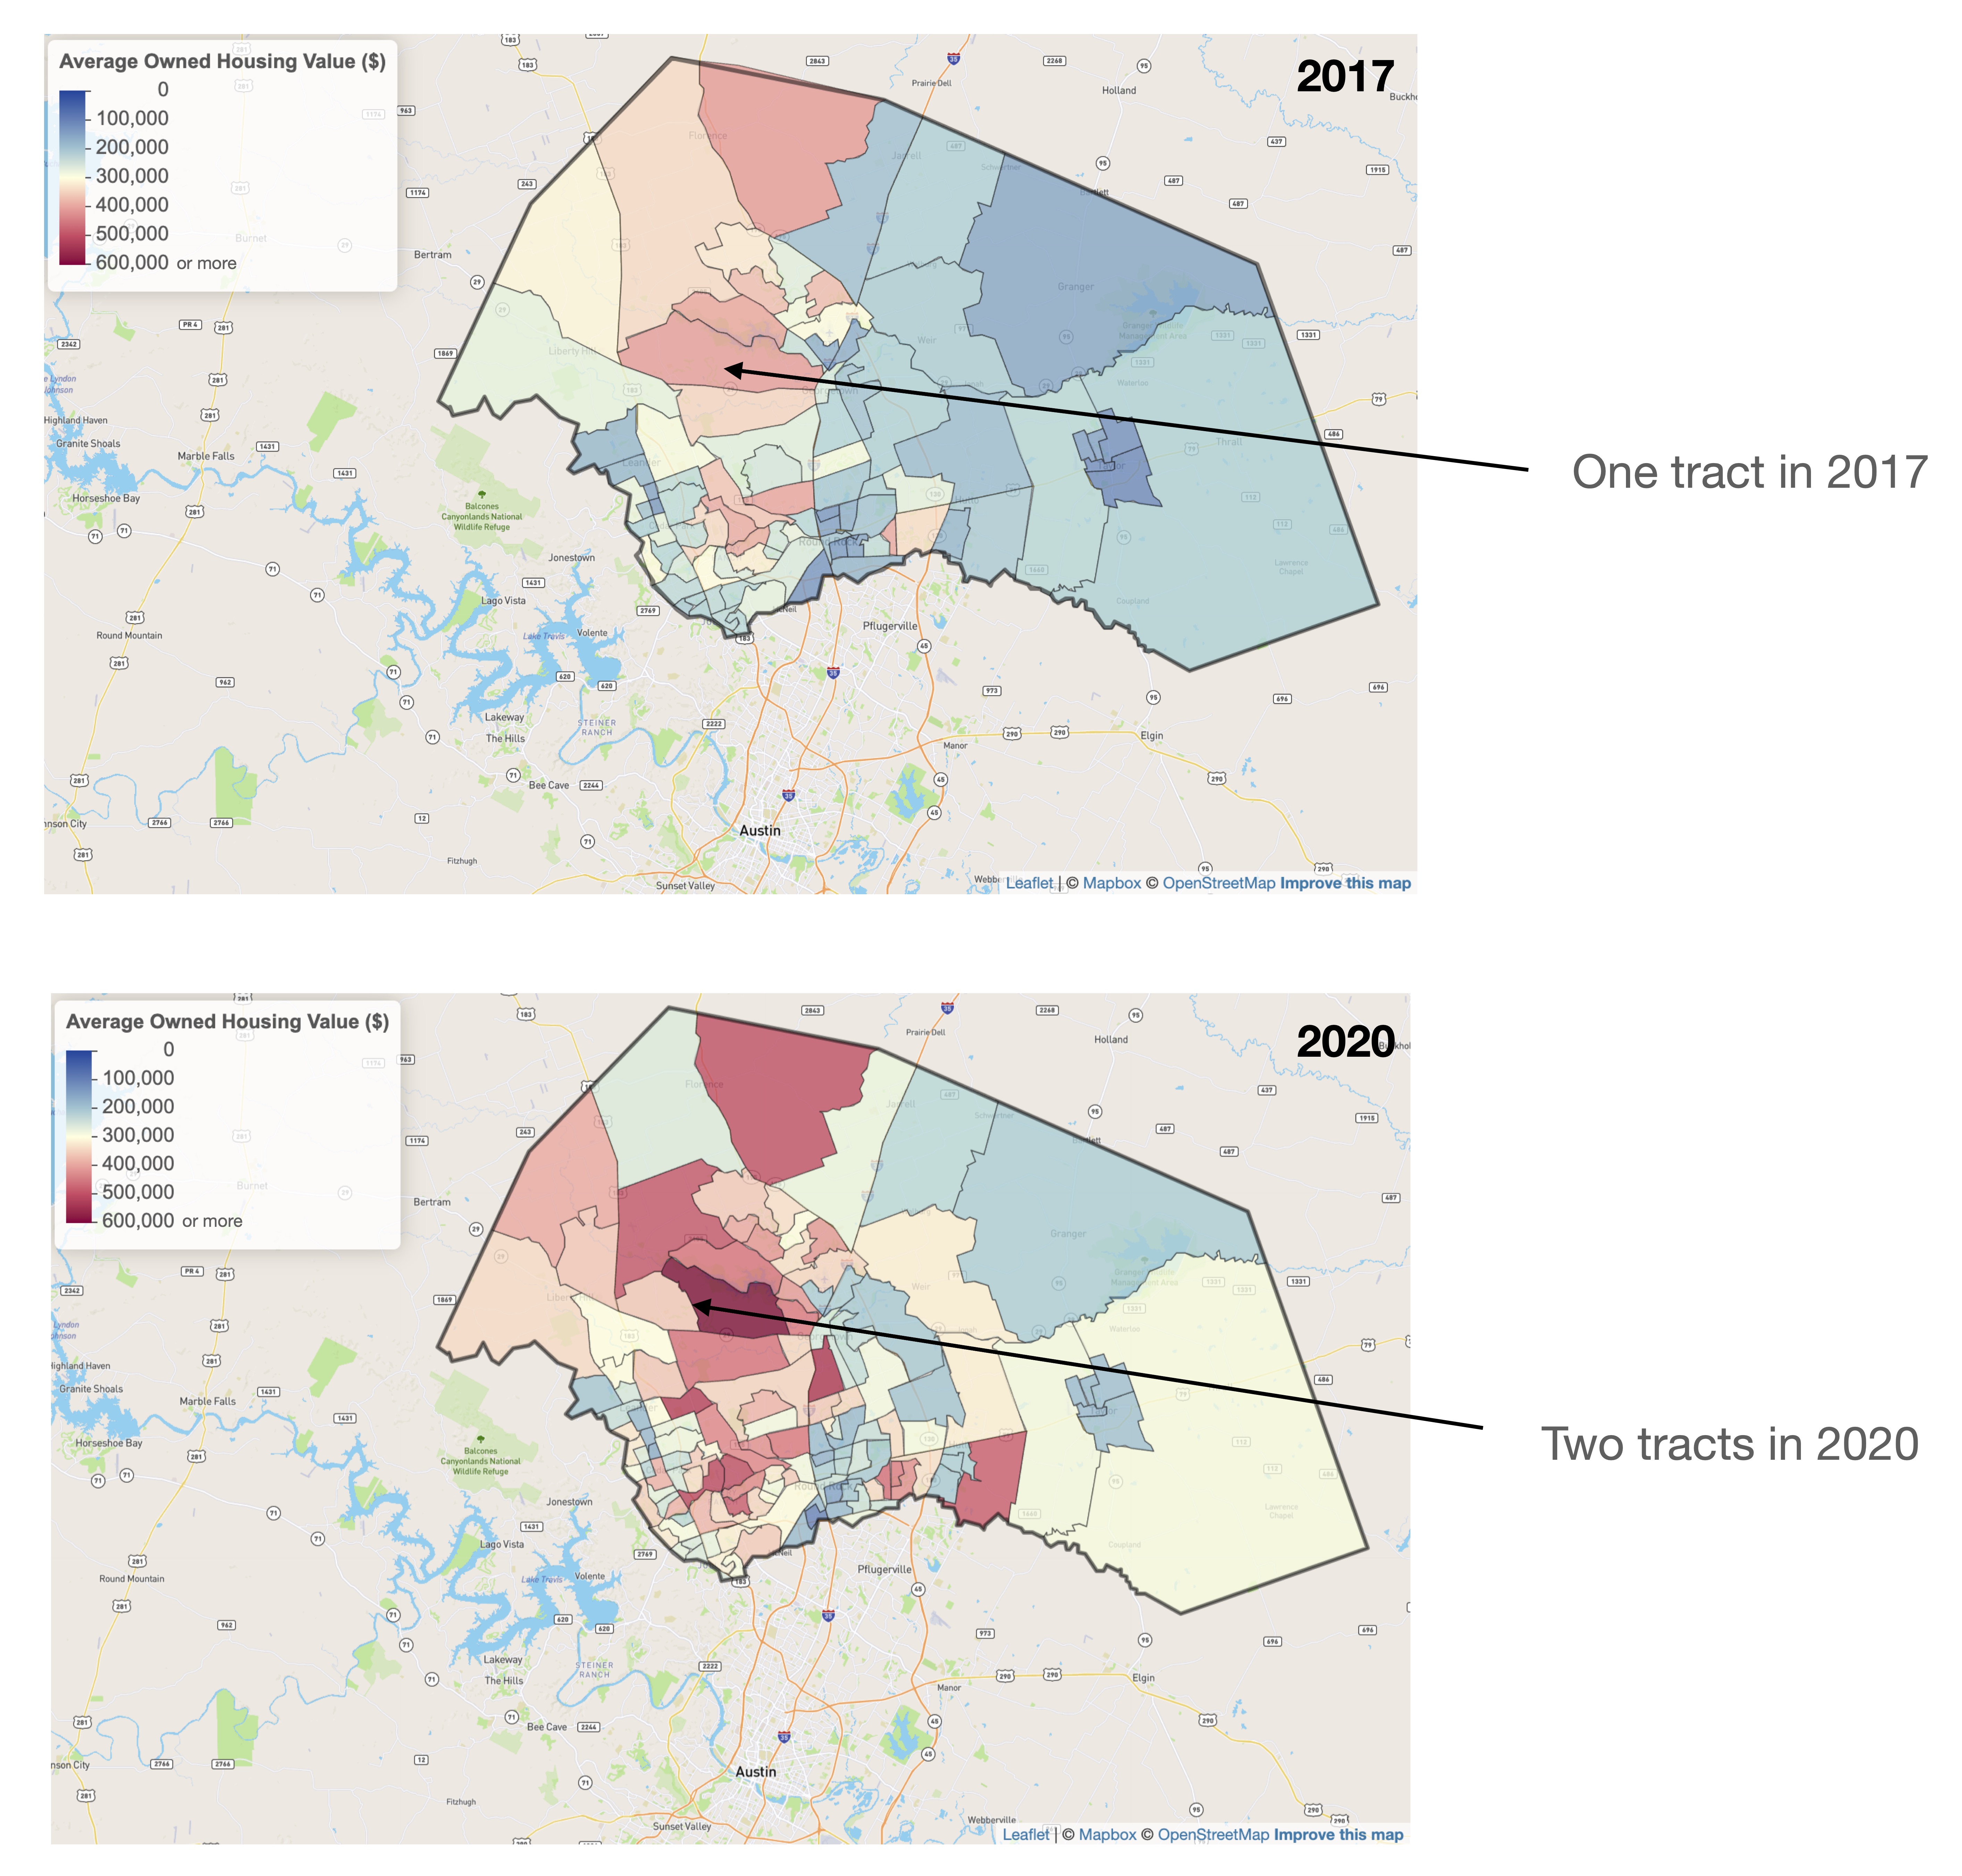
Figure 1. Average owned housing values reported by the U.S. Census Bureau for census tracts in Williamson County, just north of Austin, Texas, in 2017 (top) and 2020 (bottom).
In a previous article we explained ICE’s rigorous downscaling methodology for spatially defined data from U.S. Government entities like the U.S. Census, the Federal Emergency Management Agency, the Bureau of Labor Statistics, and the Environmental Protection Agency. As that article articulated, in the municipal bond context, this approach is valuable for understanding the characteristics of issuers, because once appropriately downscaled, data can be re-aggregated up to any geospatial boundary, including but not limited to any city, school district, turnpike authority, or even any area within a 30-minute drive time from a hospital.
However, ICE’s downscaling and re-aggregation approach also has broader implications for anyone interested in U.S. Census-provided population characteristics at the individual community level. As explained above, ICE can downscale and re-aggregate census data from any year to any arbitrary boundary—including census-defined boundaries from other years.
ICE’s methodology of downscaling data onto a 100 meter x 100 meter grid with intelligent weighting schemes and then re-aggregating it up to new boundaries simplifies comparisons of census information across different years (Figure 2). Changes in census data over time, like the average owned housing value by tract in Williamson County between 2017 and 2020, can be examined based on fixed boundaries—whether those are defined by the 2017 census tracts, the 2020 census tracts, or census tracts from any other year.
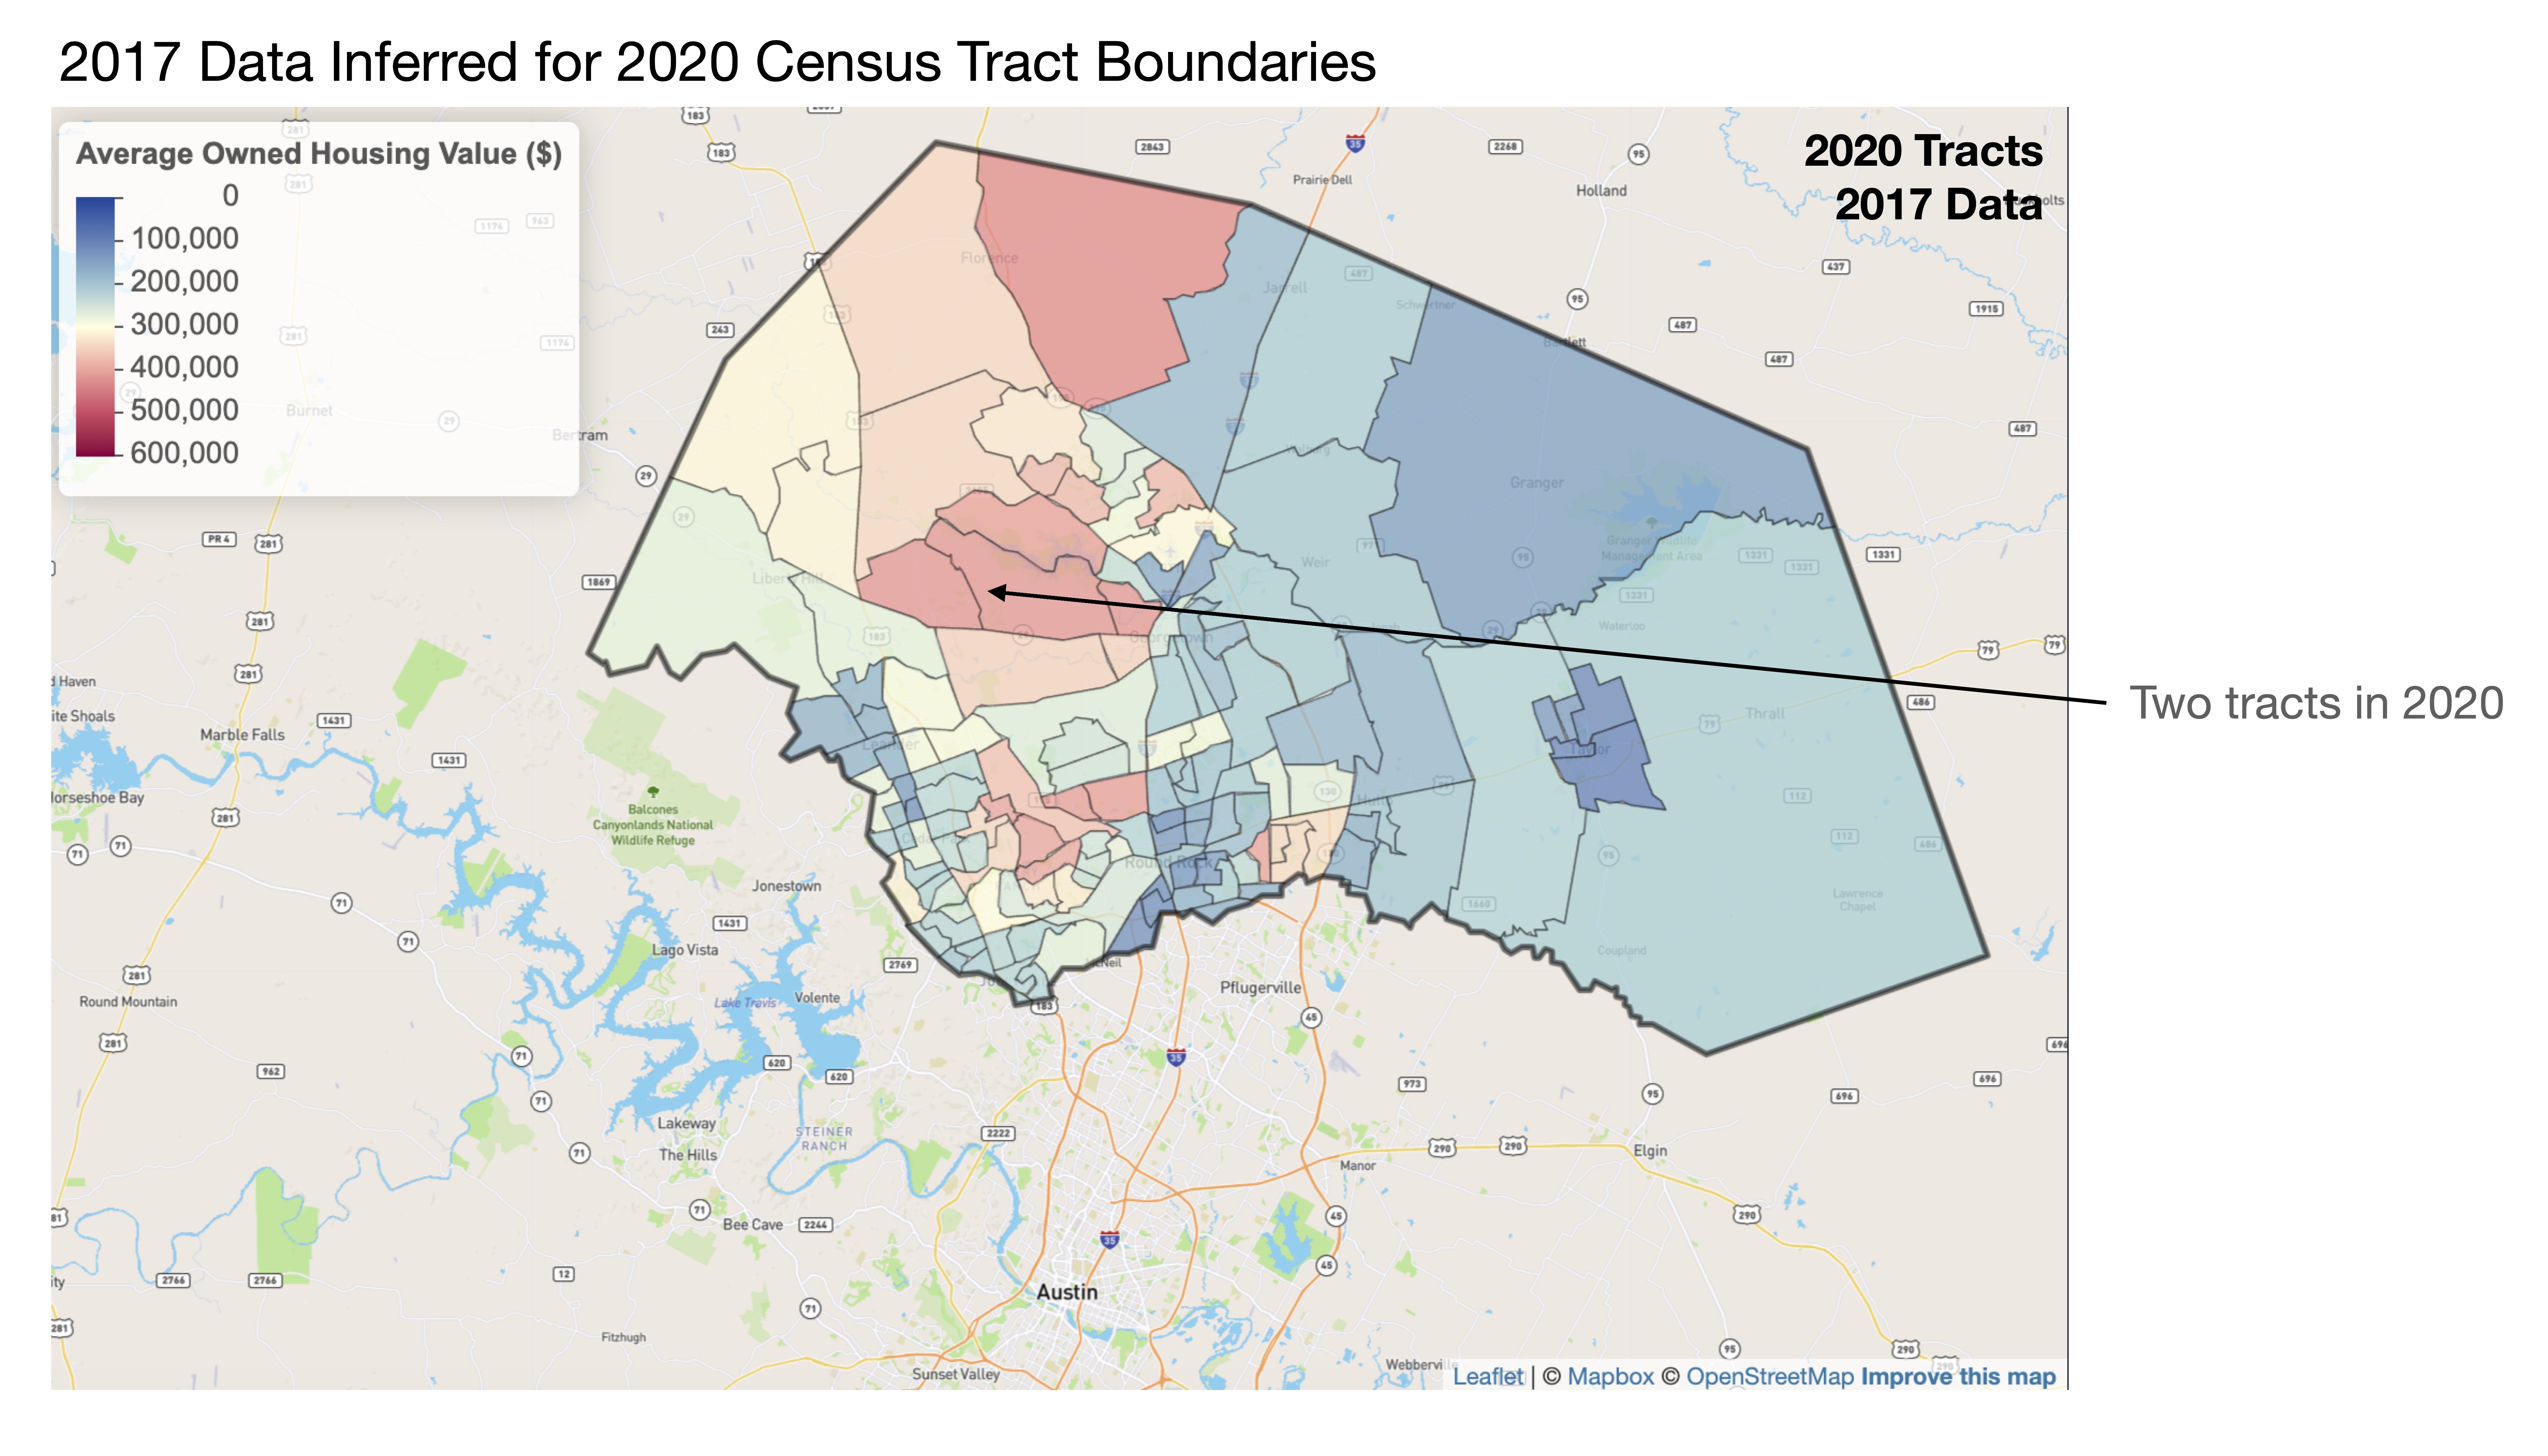
Figure 2. Average owned housing values in 2017 from the U.S. Census’ American Community Survey, inferred for 2020 tract boundaries using ICE’s downscaling and re-aggregation methodology.
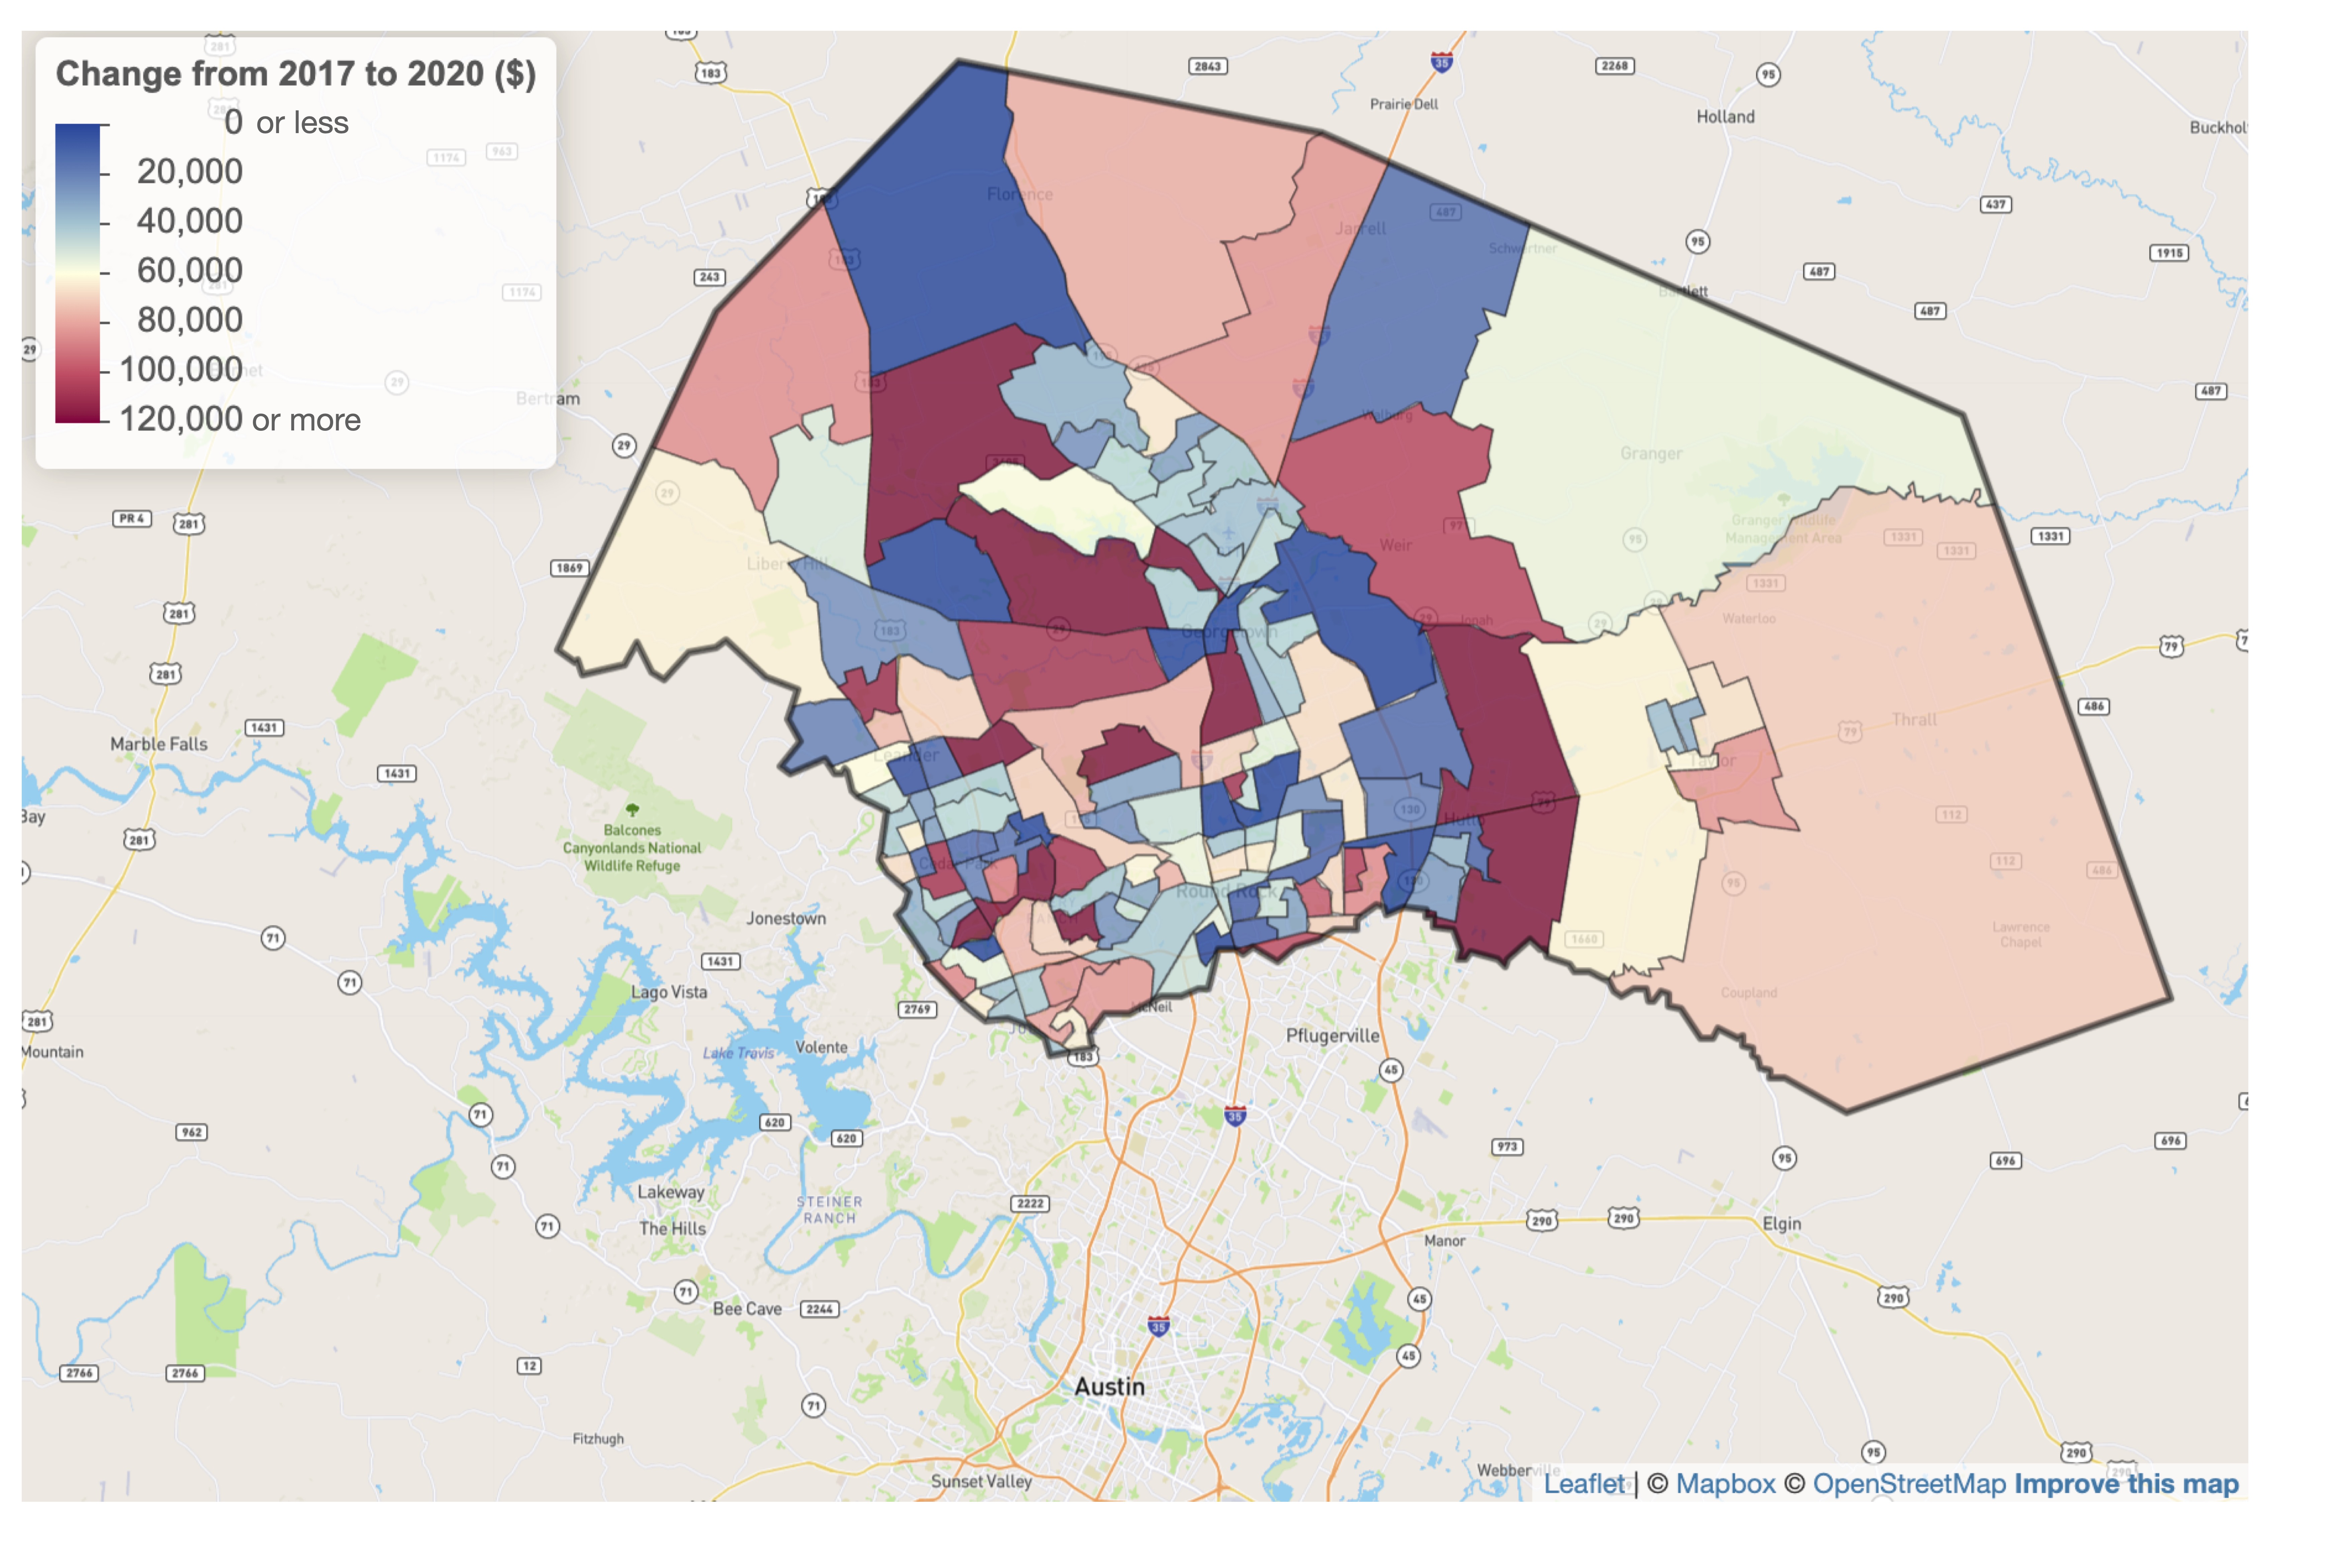
Figure 3. The inferred change in average owned housing values from the U.S. Census’ American Community Survey in 2017 and 2020, based on ICE’s methodology. This comparison is trivial (plain old subtraction) once 2017 average owned housing values are inferred for 2020 tract boundaries.
The power of ICE’s methodology is especially clear when compared to other approaches. A more naïve methodology for estimating 2017 housing values for 2020 tracts would be to estimate the percentage of area of each 2020 tract that overlaps with each 2017 tract and take a weighted average of the 2017 values based on those spatial overlaps (Figure 3). However, using this simplistic area-based approach, ICE’s inferences suggest that some tracts’ 2017 average owned housing value estimates could be off by over $4,000 (Figure 4).
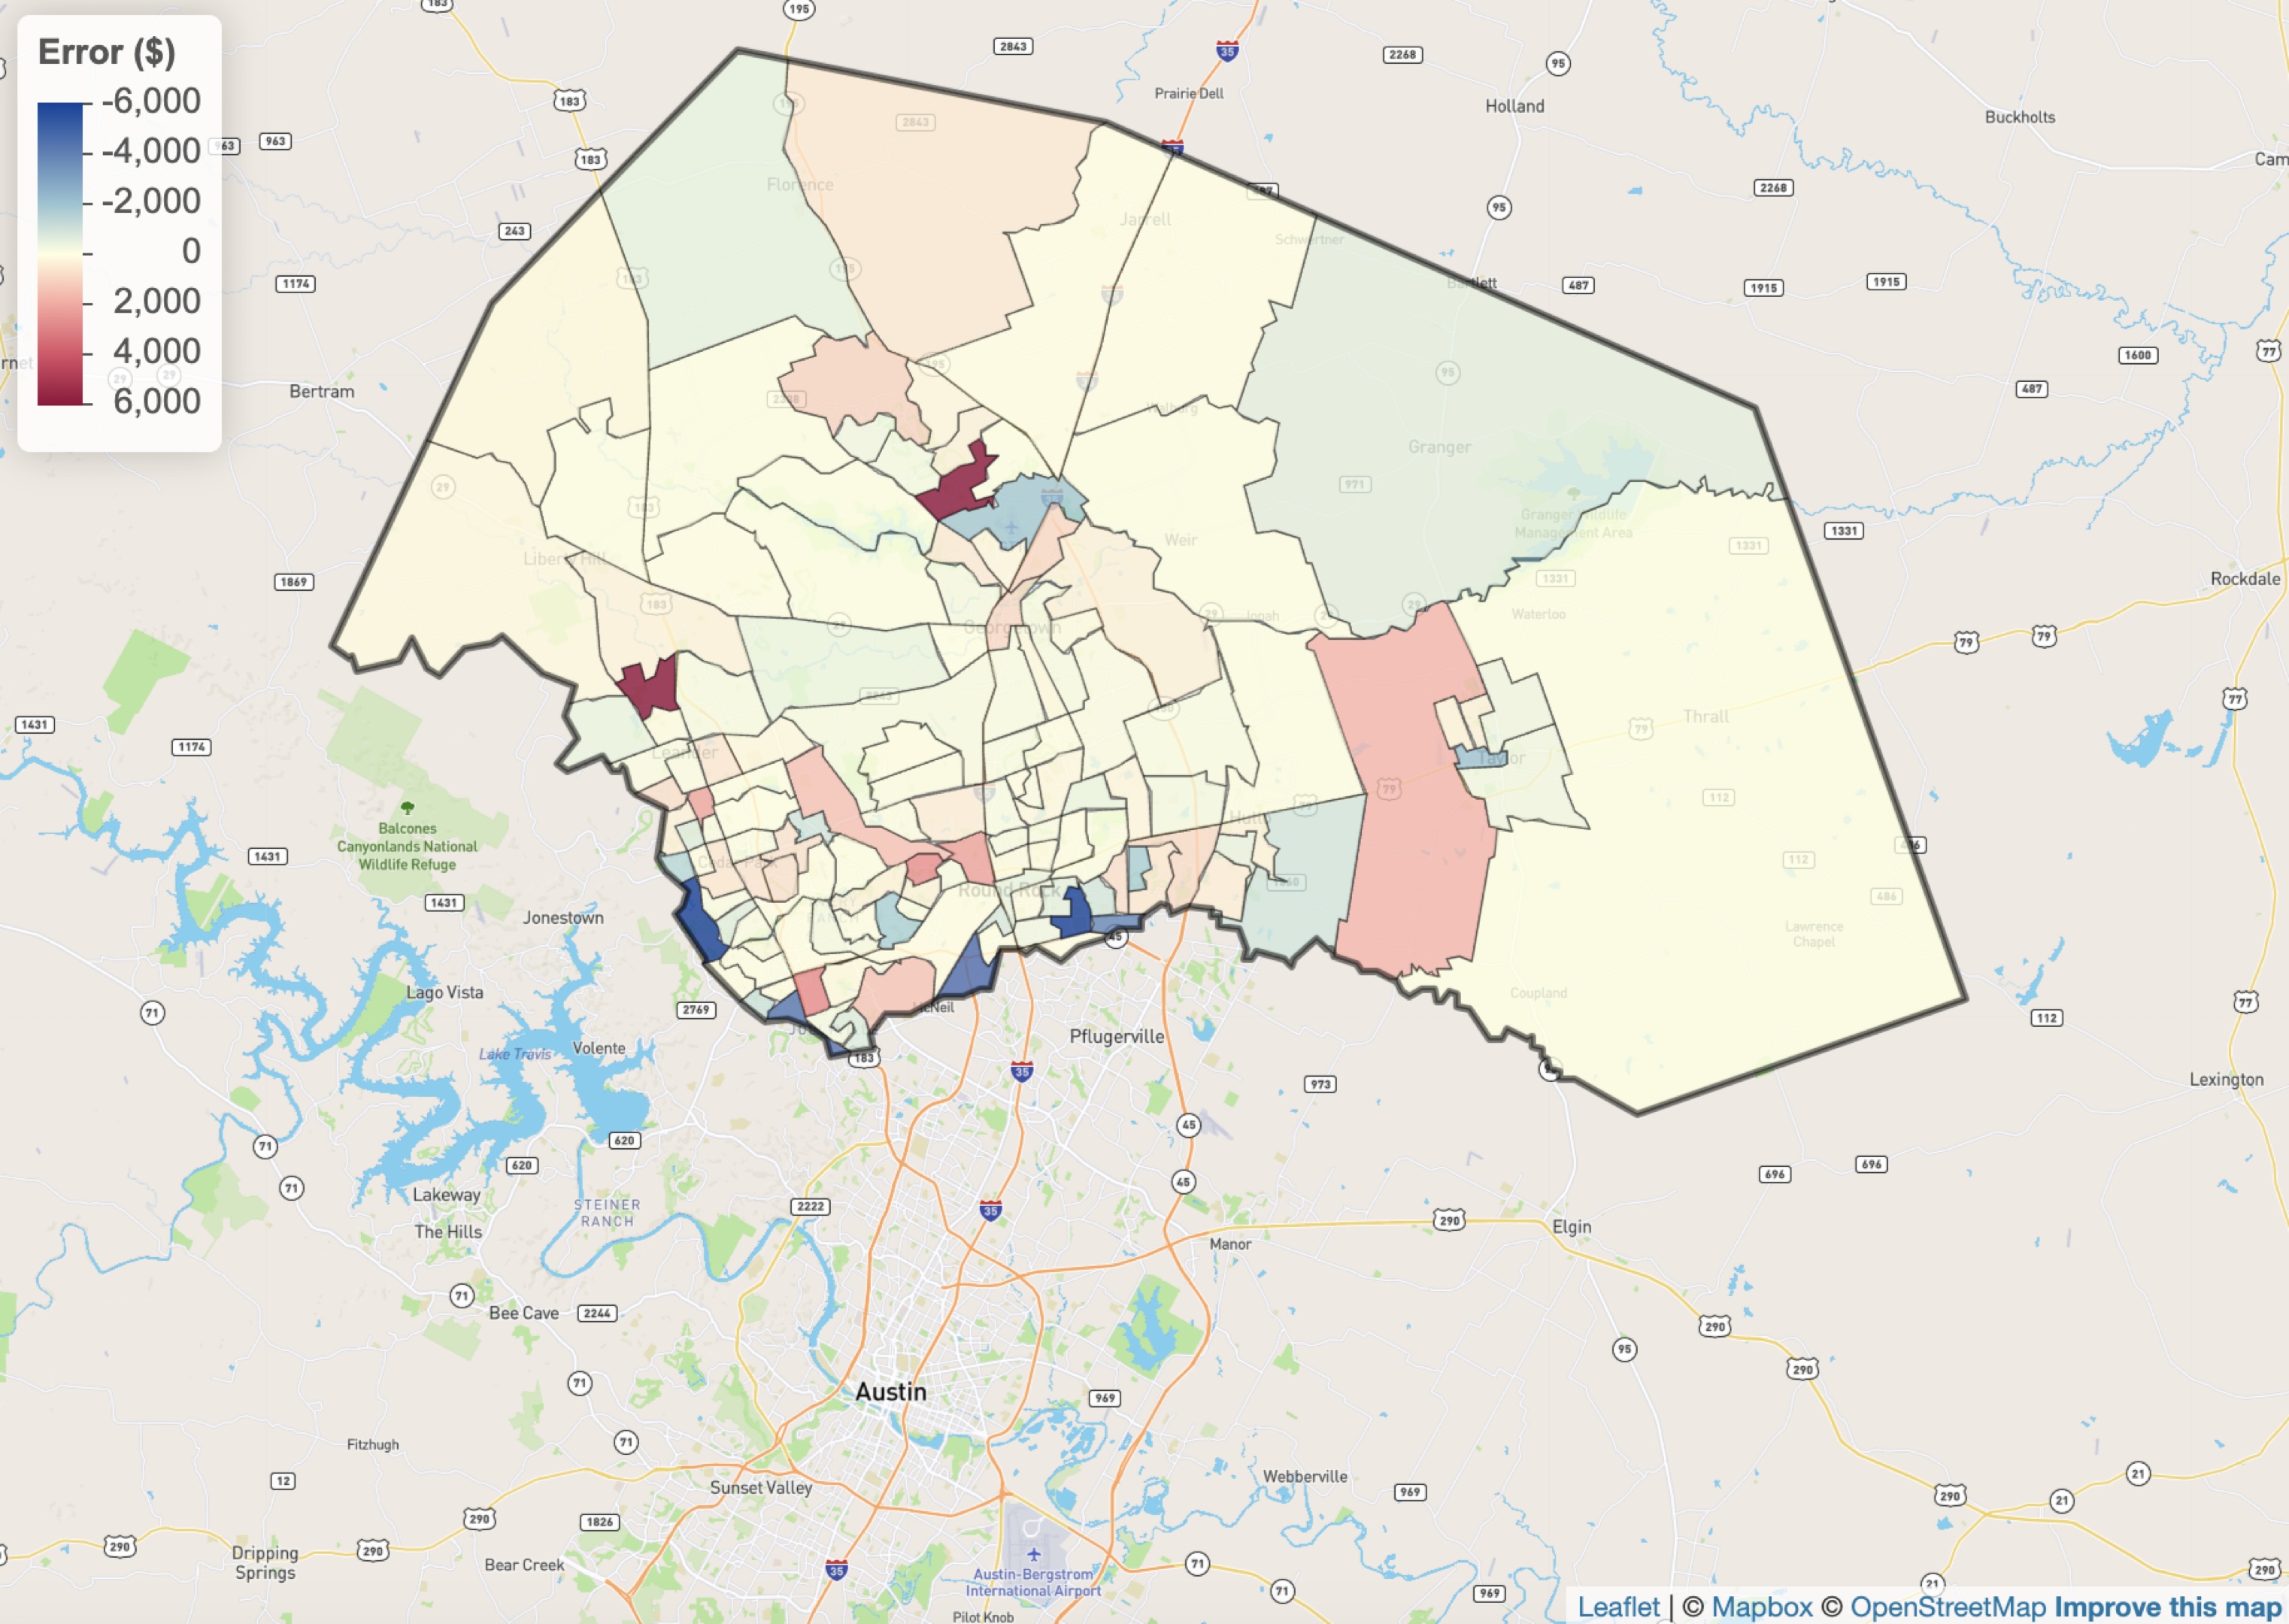
Figure 4. Inferred errors in 2017 average owned housing values (estimated for 2020 tracts) based on a simple area-weighting approach, as compared to ICE’s downscaling and re-aggregation methodology.
For U.S. Census Data, the implications of ICE’s downscaling and re-aggregation approach are difficult to understate. Regardless of the year in which the tract was defined by the Census, ICE can provide accurate inferences about the local community’s socioeconomic, employment, and educational characteristics of that tract—for any year. This methodology allows us to provide clients, academic partners, and other interested parties with detailed comparisons of census information through time at scales that would be impossible otherwise.