
How municipal bond market participants can help address climate justice
Published
November 2023
Senior Director, Climate & ESG
Many socioeconomically disadvantaged communities across the U.S. are exposed to significant physical climate risks.
In the western United States, wildfire suppression efforts often disproportionately benefit affluent neighborhoods.1 Meanwhile, low-income farmworkers living beside verdant golf courses struggle to access clean drinking water.2 As the global awareness of these sorts of disparities increase, there has been a growing focus on climate justice—the idea that climate impacts and mitigation efforts should be considered in the context of historical injustice and human rights.3,4 Local and state governments across the U.S. are now starting to integrate climate justice into their disaster mitigation and response strategies.5
The ICE Social Impact Score, a score designed to quantify the socioeconomic vulnerability of communities within a given geographical area, and the ICE Climate Risk Score, a score designed to quantify physical climate risk, can together provide insight into the U.S. municipal bond market and the climate justice effort. ICE Sustainable Finance uses the geographic boundaries of obligors to assign these scores, allowing market stakeholders to identify communities that are socioeconomically disadvantaged and also exposed to significant physical climate risk. From a climate justice perspective, these may be the most vulnerable communities in the country—which suggests they may also be communities that can experience outsized benefits from investment in climate adaptation and resilience projects. Many socioeconomically disadvantaged communities across the U.S. are already disproportionately exposed to air pollution and carbon transition risk.6,7

Figure 1. The percent of statewide outstanding issuance associated with high (≥75) ICE Social Impact Scores (left) and high (≥2) ICE Climate Risk Scores (right). Source: ICE Sustainable Finance as of October 5, 2023.
Across the United States, over 13% ($545 billion)8 of total outstanding municipal bond issuance (over $4 trillion) is obligated to coverage areas or municipalities with high physical climate risk, defined as having an ICE Climate Risk Score ≥ 2. About 12% ($477 billion) of total outstanding municipal bond issuance is obligated to areas that are socioeconomically vulnerable, defined as communities with ICE Social Impact Score ≥ 75.
The overlap between this issuance is significant: about 5% ($197B) of total outstanding issuance is associated with communities that are both socioeconomically vulnerable and exposed to high physical climate risk, and this outstanding debt is geographically concentrated across a few states in the south and southeastern U.S.
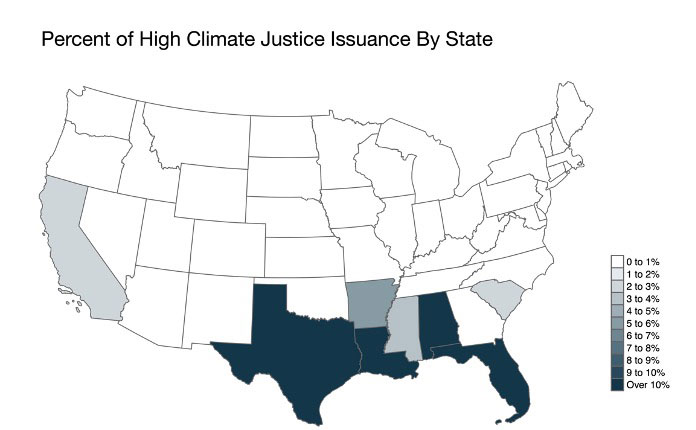
Figure 2. The percent of total statewide outstanding issuance associated both high (≥75) ICE Social Impact Scores and high (≥2) ICE Climate Risk Scores. Source: ICE Sustainable Finance as of October 5, 2023.
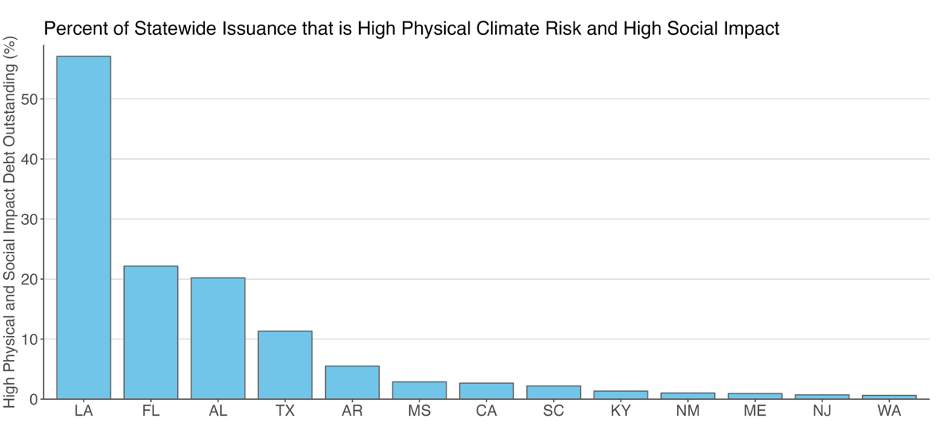
Figure 3. The percent of total statewide outstanding issuance associated both high (≥75) ICE Social Impact Scores and high (≥2) ICE Climate Risk Scores. States with percent of statewide issuance values less than 0.5% are not included. Source: ICE Sustainable Finance as of October 5, 2023.
Among these states, Louisiana stands out: over 50% of issuance across the state is associated with high physical climate risk obligors who are also socioeconomically vulnerable—more than twice the percentage across all other states. Looking at the ICE Climate Risk Scores and Social Impact Scores by census tract across the state, it is clear why: almost the entire southern coast, including much of greater New Orleans, is at significant physical climate risk, and much of the coastline is also socioeconomically disadvantaged.

Figure 4. ICE Social Impact Scores (left) and ICE Climate Risk Scores (right) by census tract across Louisiana. Source: ICE Sustainable Finance as of October 5, 2023.
The country gained a visceral understanding of the challenges faced by Louisiana in the aftermath of Hurricane Katrina in 2005. The hurricane demonstrated the devastating and disproportionate toll that extreme weather can have on low-income communities,9 and spotlighted how the health of these communities is connected to the rest of the country. On September 2, 2005, only a few days after the storm hit New Orleans, a New York Times headline pointed out this connection: “Billions of dollars in municipal bonds helped build New Orleans and the surrounding areas hit by Hurricane Katrina. Now, the municipal bond market is warily watching to see whether this natural disaster could turn into a municipal finance one as well.”10
As the New York Times headline suggests, from a market perspective, building the resilience of these communities may be in everyone’s interest. We have shown in previous research that socioeconomically vulnerable communities (those with ICE Social Impact Scores > 50) tend to have less access to the municipal bond market than their more affluent counterparts.11 As the impacts of climate change worsen, low-income communities exposed to high physical climate risk will likely face ever-higher costs of borrowing, while more affluent communities may still be able to afford debt capital for climate adaptation, mitigation, and recovery efforts. In other words, without intervention, existing disparities in wealth and climate resilience across the country—disparities that horrified the world after Katrina—may only widen.

Figure 5. ICE Climate Risk Scores by census tract across Louisiana; grey tracts are tract associated with Social Impact Scores < 75 and ICE Climate Risk Scores < 2. (Source: ICE Sustainable Finance as of 10/05/2023)
1 Plantinga, A.J., Walsh, R., & Wibbenmeyer, (2002). M. Priorities and Effectiveness in Wildfire Management: Evidence from Fire Spread in the Western United States. Journal of the Association of Environmental and Resource Economists. 9, 4, 603–639.
2 Weil, E. & Pons, M.R. (Aug 17, 2021) Postcard From Thermal: Surviving the Climate Gap in Eastern Coachella Valley, ProPublica. (Source)
3 Lakhani, N. (March 29, 2023). United Nations adopts landmark resolution on climate justice. The Guardian. (Source)
4 State and Federal Environmental Justice Efforts Report (last updated May 26, 2023). National Conference of State Legislatures Report. (Source)
5 Press Release (March 27, 2023). New York State Climate Justice Working Group Finalizes Disadvantaged Communities Criteria to Advance Climate Justice, New York Department of Environmental Conservation, (Source)
6 ICE Sustainable Finance Research and Content (Apr 2023). Municipal Bonds: reducing pollution in minority communities. ICE Insights. (Source)
7 risQ and DPC Data. US Carbon Transition Risk: The Highwire Act of Municipal Credit Impairment and Climate Justice. RisQ, Inc. Medium Blog Post. (Source)
8 All numbers and charts used in this article, unless otherwise cited, are sourced from ICE Sustainable Finance models and data as of October 5, 2023 and are available via ICE’s product offerings.
9 Gabe, T., Falk, G., & McCarty, M. (Nov 4, 2005). Hurricane Katrina: Social-Demographic Characteristics of Impacted Areas. Congressional Research Service Report, Library of Congress. Retrieved from (Source) on October 6, 2023.
10 Wayne, Leslie. (Sept 2, 2005). Debt in Storm Areas worries the Municipal Bond Market. The New York Times. (Source)
11 DeVries P, Kodra E & C Hay (Jan 2023). The link between access to U.S. municipal debt and socioeconomic outcomes. ICE Research Report. (Source)