
Municipal bonds: reducing pollution in minority communities
Published
April 2023
Takeaways
- ICE’s analysis reveals that minority populations in urban centers across the United States are disproportionately exposed to airborne pollution.
- Municipal bonds issued to improve or create urban mass transit systems and other vehicle-reducing or greenspace initiatives (parks, bike, and bus lanes, etc.) could be potentially beneficial from both a climate perspective and a health equity perspective.
Minority communities across the U.S. are disproportionately exposed to dangerous air pollution
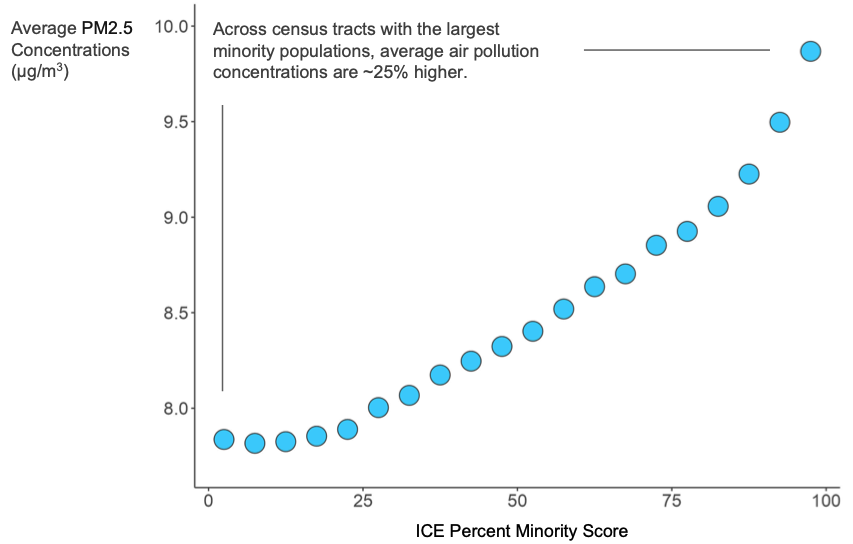
Source: ICE Sustainable Finance Data as of Jan 6, 2023
The insight
Fine airborne particulate matter less than 2.5 microns in width (PM2.5) is a dangerous air pollutant produced during the burning of fuel, including exhaust from vehicles and emissions from gas stoves, candles, power plants, and wildfires. Exposure to PM2.5 is associated with a range of adverse health outcomes, including asthma, cardiovascular disease , lung cancer, and death. According to a recent global study, over 4 million deaths in 2019 were PM2.5-related; in the United States, estimates of excess deaths caused by this airborne pollutant range from 85,000 to 200,000. Even short exposure times (days rather than years) at concentrations below current standards set by the Environmental Protection Agency (EPA) can lead to negative health impacts. For all these reasons, PM2.5 is often referred to as the most significant environmental health risk factor in the United States.
Importantly, ICE’s analysis demonstrates that the burden of this airborne pollutant is not distributed equally. The relationship between the ICE Percent Minority Score—a score designed to represent the relative size of minority communities within any given geographic area—and the average concentrations of PM2.5 of census tracts across the country demonstrates that exposure to this dangerous environmental health hazard falls disproportionately on minority populations across the United States. These systematic racial disparities in pollution exposure have persisted despite overall declines in ambient airborne pollution concentrations across the country since the 1980s.
Some experts believe tens of thousands of lives could be saved if the United States could further reduce pollution levels. By one estimate, a 40% reduction in PM2.5 concentrations nationwide would lead to a more than 100,000 decrease in excess U.S. deaths, with the greatest decreases in California and Texas. Though many different sectors of the economy contribute to PM2.5 emissions, one recent study identified coal-powered electricity generation and passenger vehicle use as particular targets for saving lives. For impact-oriented bond market participants, projects related to the improvement or creation of urban mass transit systems, vehicle-reducing or greenspace initiatives (parks, bike lanes, etc.), and renewable energy generation may be of particular interest. These kinds of bond issuances could be viewed as potentially beneficial from both racial and health equity perspectives, whether or not they are specifically labeled as “green,” “social,” or “sustainable."
The tools and analysis behind these visualizations
These visualizations combine the ICE Percent Minority Score with data from the EPA on PM2.5 pollution levels across the country. The ICE Percent Minority Score is one of the seven component sub-scores of the ICE Social Impact Score. While the composite Social Impact Score is designed to quantify the overall potential benefit of investment in a community or municipality, the purpose of the Percent Minority Score is more specific: it uses demographic data from the U.S. Census to quantify the relative size of minority communities living within any geographical area across the United States.
ICE’s pollution data is based on annual mean concentrations of PM2.5 in micrograms per cubic meter (µg/m3) by census tract published by the EPA (2018 data is shown in the visualizations). ICE then leverages auxiliary spatial data like the locations of residential and commercial buildings to downscale these EPA-provided concentrations onto a national 100-m x100 m nested grid that can be re-aggregated back up to any geographical boundary of interest. This methodology allows ICE to estimate average ambient PM2.5 concentrations in a statistically rigorous way for any municipality, school district, or other geographically defined area.
1 Lin, S., Munsie, J. P., Hwang, S. A., Fitzgerald, E., & Cayo, M. R. (2002). Childhood asthma hospitalization and residential exposure to state route traffic. Environmental Research, 88(2), 73–81.
4 Sang S., Chu C., Zhang T., Chen H., Yang X. (2022). The global burden of disease attributable to ambient fine particulate matter in 204 countries and territories, 1990-2019: A systematic analysis of the Global Burden of Disease Study 2019. Ecotoxicology and Environmental Safety, 238, 113588. doi:10.1016/j.ecoenv.2022.113588.
5 Tessum, C., Paolella, D., Chambliss, S., Apte, J., Hill, J. & Marshall, J. (2021). PM2.5 polluters disproportionately and systematically affect people of color in the United States, Science Advances, 7(18), doi: 10.1126/sciadv.abf449.
6 Shi, L., Zanobetti, A., Kloog, I., Coull, B.A., Koutrakis, P., Melly, S.J., & Schwartz, J.D. (2016). Low-Concentration PM2.5 and Mortality: Estimating Acute and Chronic Effects in a Population-Based Study. Environmental Health Perspectives, 124(1), 46-52. doi: 10.1289/ehp.1409111.
7 Tessum, C., Apte, J., Goodkind, A., Muller, N., Mullins, K., Paolella, D., Polasky, S., Springer, N., Thakrar, S., Marshall, J., Hill, J. (2019). Inequity in consumption of goods and services adds to racial-ethnic disparities in air pollution exposure. Proceedings of the National Academy of Sciences, 116(13), 6001-6006. doi: 10.1073/pnas.1818859116.
8 Colmer, J., Hardman, I., Shimshack, J., Voorheis, J. (2020). Disparities in PM 2.5 air pollution in the United States. Science, 369(6503), 575-578. doi: 10.1126/science.aaz9353.
9 Vodonos, A., Schwartz, J. (2021). Estimation of excess mortality due to long-term exposure to PM2.5 in continental United States using a high-spatiotemporal resolution model. Environmental Research, 196, 110904. doi: 10.1016/j.envres.2021.110904.
10 Thakrar, S. Balasubramanian, S. Adams, P., Inês M., Muller, N., Pandis, S., Polasky, S., Pope, C., Robinson, A., Apte, J., Tessum, C., Marshall, J., & Hill, J. (2020). Reducing Mortality from Air Pollution in the United States by Targeting Specific Emissions Sources. Environmental Science and Technology Letters, 7(9), 639-645, doi: 10.1021/acs.estlett.0c00424