
Heat stress: a threat to fiscal stability for municipal bonds?
Published
March 2023
ICE
Takeaways
- ICE Climate Physical Risk Data suggest that heat stress across the United States will rise over the next few decades, reaching especially high levels in the southern parts of the country.
- Many municipal bonds have maturities that extend out to 2040 or 2050, a period over which human and economic losses related to heat stress could affect the fiscal stability of municipalities in high heat stress regions.
Source: ICE Sustainable Finance as of 1/06/23
The insight
Over the next few decades, ICE Climate Risk data suggest that heat stress will increase in many parts of the country. The impacts of this increasing heat could be both far-reaching and tragic: according to the National Weather Service, heat has caused more Americans deaths than any other weather-related hazard over the last thirty years.1 During the Pacific Northwest heatwave of 2021 alone, there were about 600 excess deaths in the region.2
The devastating effects of extreme heat also extend to the economy. A recent report by the Atlantic Council3 estimates that the United States is losing $100 billion a year due to reductions in labor productivity caused by heat. The same Atlantic Council report projects that heat-related national economic losses could double by 2030 and the annual number of heat-related deaths across the country could rise from ~8,500 a year to ~60,000. By 2050, without intervention, corn yields across the country could decrease by as much as 10%.
The tools and analysis behind this visualization
ICE’s heat stress model leverages historical gridded North American Reanalysis Data4 of daily average temperature, daily average relative humidity, and maximum daily temperatures. Using ICE’s statistical climate conditioning methodology, the average numbers of days above certain temperature and heat index thresholds across the country are projected into the future using two Intergovernmental Panel on Climate Change Representative Concentration Pathways (RCPs): RCP 8.5, often referred to as the “business-as-usual” future emissions trajectory (shown in the animation), and RCP 4.5, a more moderate emissions pathway.
The results of the ICE heat stress model can be computed for any geographically defined area within the coterminous United States. In Scottsdale, Arizona, for example, the average number of days a year with a heat index greater than 95 degrees is projected to be more than a month longer than the historical average by 2050 under the RCP8.5 scenario. See the projections below in Figure 1. In other words, under this climate scenario, residents of Scottsdale could be living under heat conditions that put them at risk of sunstroke, heat exhaustion, and heat cramps with prolonged exposure5 for about half of the year by 2050. The economic, agriculture, and human losses associated with these levels of heat stress could in turn depress local housing prices, population levels, and tax revenues, with a myriad of negative effects on the long-term fiscal stability of local municipalities, developers, and utilities.
Scottsdale city: heat stress over time
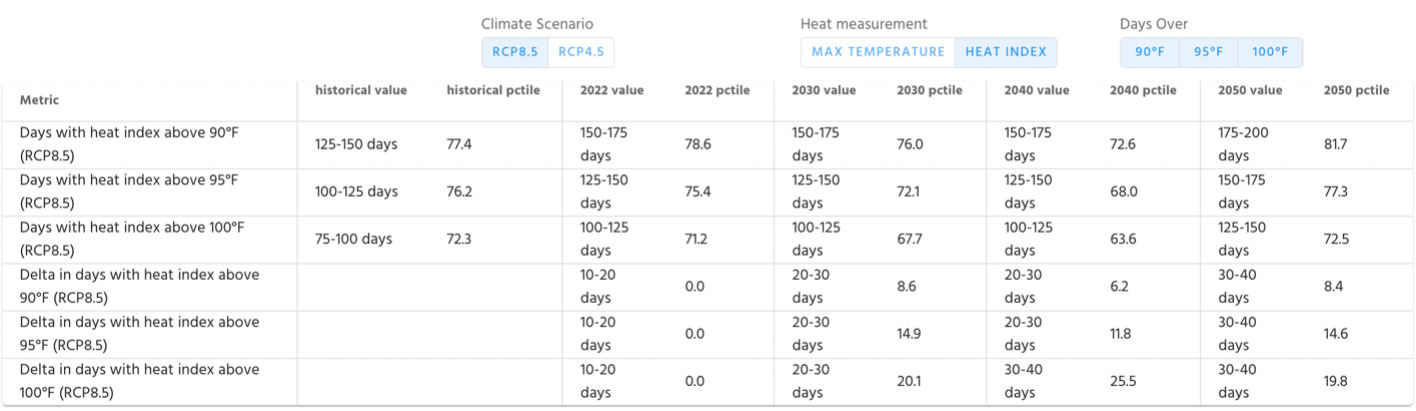
Figure 1: The ICE heat stress model results for Scottsdale, Arizona. Source: ICE Sustainable Finance, as of Feb 10, 2023.
1 Weather Related Fatality and Injury Statistics, The National Weather Service
4 Mesinger, F., DiMego, G., Kalnay, E., Mitchell, K., Shafran, P.C., Ebisuzaki, W., Jovic, D., Woollen, J., Rogers, E., Berbery, E.H. & Ek, M.B. (2006). North American regional reanalysis. Bulletin of the American Meteorological Society, 87, 3, 343-360.