
Public transit improvements: where can municipal bond issuances have the biggest impact?
Published
April 2023
Takeaways
- Studies indicate the use of public transit is linked to decreased pollution and other health benefits at both individual and population levels.
- Many municipal bond issuances that fund public transit construction and improvements could be viewed as “green” or “sustainable,” even if they do not carry explicit labels.
Percentages of Workers Commuting Sustainably in the Largest US Cities
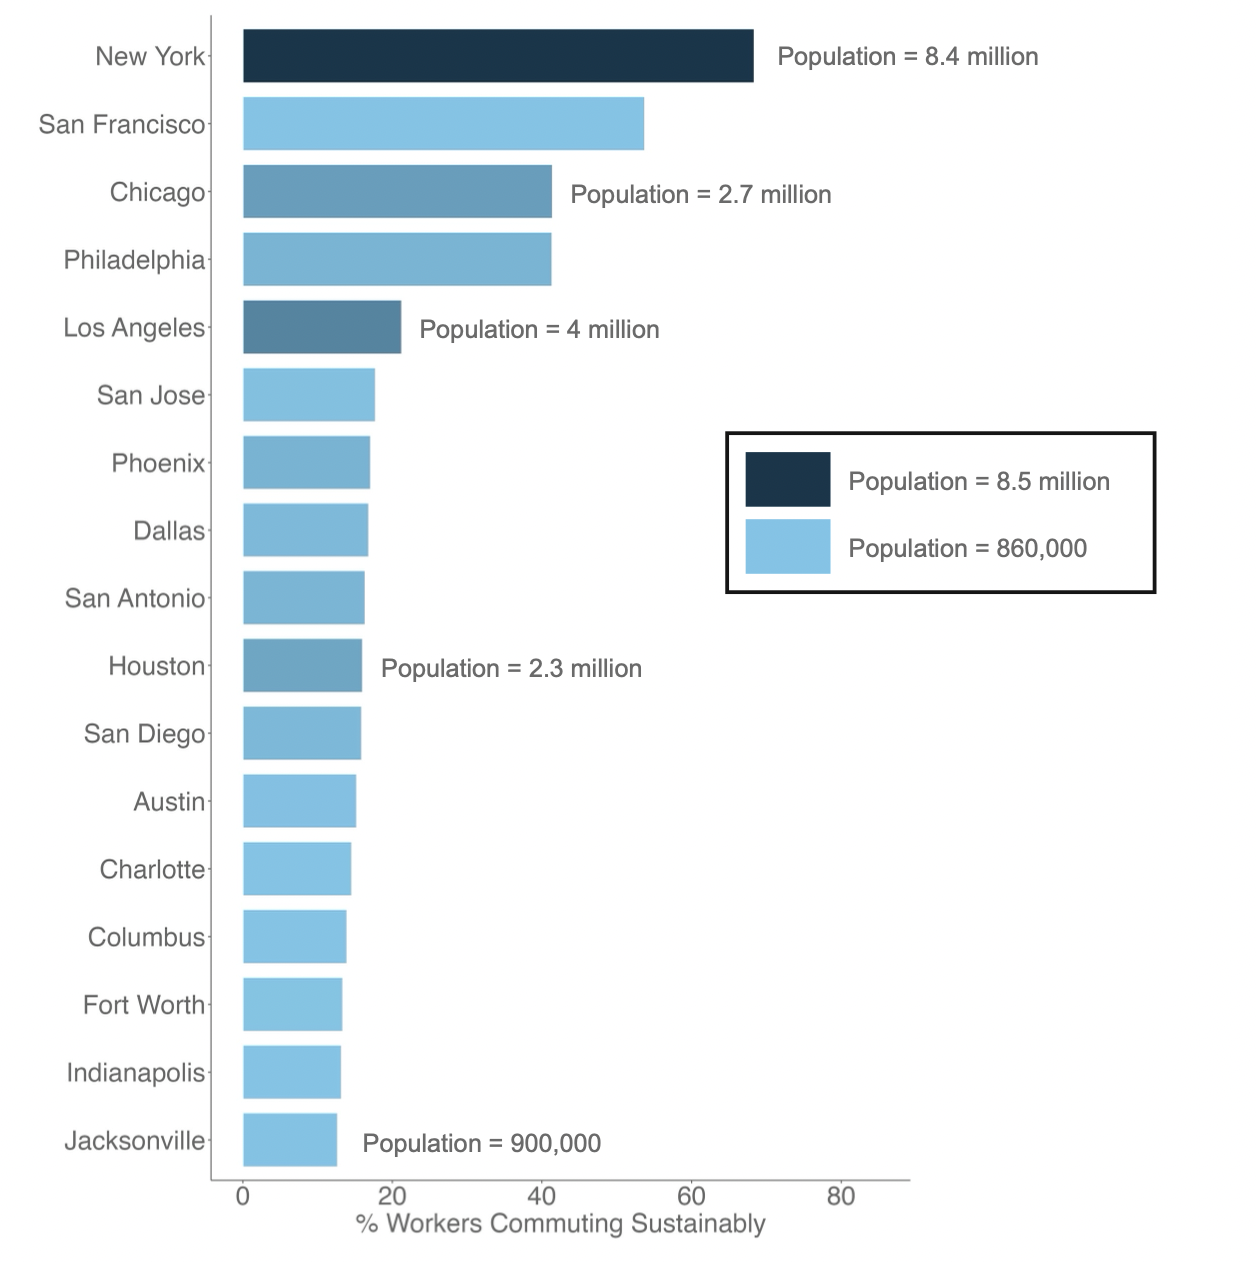
Source: ICE Sustainable Finance Data as of Feb 10, 2023
The insight
According to the Centers for Disease Control and Prevention, the increased use of public transit is associated with public health benefits, including fewer fatalities and injuries from motor vehicle accidents, less pollution, and more physical activity. A study commissioned by the American Public Transportation Association1 estimated that public transit emits 5% of the carbon monoxide and roughly half as much carbon dioxide as personal vehicles for every passenger mile traveled. Other studies associate public transit use with more walking per day and protection against increases in body mass index. 2 3
Since Massachusetts issued the first $100 million Green Bond in 2013,4 the total amount of municipal debt carrying a green label has grown dramatically. As of 2019, green municipal bond issuances totaled $9 billion5 —a large number, but still a small portion of the $4 trillion outstanding in the municipal bond market.6 However, there are many issuances that do not carry an explicit label which may still be considered climate-aligned. Given the many benefits of public transit to human health, unlabeled bonds that fund public transit construction and improvements could be considered promising candidates for social or climate-alignment.
The tools that power this visualization
The U.S. Census publishes data on commuting patterns and population by census tract across the United States and ICE makes use of auxiliary spatial information like the locations of residential and commercial buildings to downscale this data onto a national 100-m x 100-m nested grid. This approach makes it possible to then re-aggregate the information back up to any municipality or other geographical boundary of interest. For example, across the biggest cities7 in the United States, New York City has by far the highest percentage of workers (>60%) who commute by foot, bike, or public transit and a large population, while the much smaller city of Jacksonville, Florida has the lowest percentage of workers who commute sustainably (<15%).8 From an impact perspective, this kind of specific geographic information could be valuable in determining both the numbers of existing sustainable commuters whose daily lives could be impacted by public transit projects, as well as the potential to increase absolute numbers of sustainable commuters.
1 Shapiro, R., Hassett, K., Arnold, F. (2022) Conserving energy and preserving the environment: The role of public transportation. American Public Transportation Association, 9,
2 Rissel C, Curac N, Greenaway M, Bauman A. (2012). Physical Activity Associated with Public Transport Use—A Review and Modelling of Potential Benefits. International Journal of Environmental Research and Public Health. 9(7), 2454-2478.
3 Brown, B., Smith, K., Jensen, W., Tharp, D. (2017). Transit Rider Body Mass Index Before and After Completion of Street Light-Rail Line in Utah. American Journal of Public Health. 107(9), 1484-1486, doi: 10.2105/AJPH.2017.303899.
4 Fidelity Capital Markets (May, 2021). In the Municipal Market, Green is the New Black
6 US Municipal Bond Statistics (Feb. 6, 2023). Securities Industry and Financial Markets Association
7 Defined here as Incorporated Places, based on U.S. Census definitions, with populations of greater than 800,000 in 2020 within U.S. Census municipal boundaries defined in 2017 (Census boundaries can shift year to year).
8 ICE metrics are based on 2020 U.S. Census information.